Stock Markets
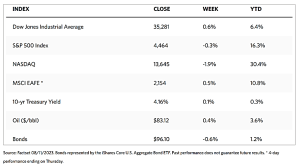
The stock markets consolidated over the past week resulting in mixed readings for the major U.S. indexes. According to the WSJ report on the markets, the Dow Jones Industrial Average (DJIA) inched up by 0.62% while the total stock market index slipped down by 0.52%. The broad S&P 500 Index dipped by 0.31% and the technology-heavy Nasdaq Stock Market Composite lost by 1.90%. The NYSE Composite rose by 0.45%. The CBOE Volatility Index, an indicator of perceived risk in the markets, fell by 13.22%. The market is seen to be taking a breather to digest the gains made over the strong rally during the first semester of this year where the S&P rose by 18% and the Nasdaq by 30% from March to July.
Light volumes marked the sideways movement in the indexes as investors weighed the improving inflation data against the recent rise in long-term interest rates. The light trading is also consistent with the summer vacation season and the end of the quarter earnings reporting We may expect to see a technical correction by 5% to 10% as the markets head into August and September which tend to historically be more volatile months. Investors should not be alarmed as they see the indexes coming down as this development is a healthy one and may present some opportunities for bargain-hunting. It may also signal the early beginnings of a longer-term bull market, especially with expected improvements in many fundamental indicators such as inflation, interest rates, and the GDP.
Midweek healthcare stocks rose as evidence was reported of the efficacy of diabetes drugs in treating obesity and related ailments. Meanwhile, information technology stocks underperformed due to concerns that rising interest rates may reduce the value of their future profits. Also exhibiting weakness were industrial stocks which is attributed to worries over a potential strike by the United Auto Workers union. Financial stocks briefly experienced a sell-off on Tuesday morning as Moody’s Investors Service lowered its ratings for ten small- and mid-cap banks. The same rating agency placed six other entities on downgrade watch. The cause for the downgrade was funding costs and the banks’ exposure to the struggling commercial real estate sector.
U.S. Economy
Economic reports were relatively light over the past week, although closely watched inflation data were released and caused some excitement among investors. Stocks jumped on Thursday’s opening bell on reports that the Labor Department’s consumer price index (CPI) advanced by 0.2% in July. This brought the CPI’s increase to 3.2% year-over-year which is slightly below expectations. Continuing pressure from shelter costs was offset by a slight drop in airline fares. As the day progressed, however, enthusiasm over the CPI data waned, and on Friday producer prices were reported to rise by 0.3% in the month which exceeded expectations slightly. Producer prices increased by 0.8% year-over-year, which is still well below the 2% Federal Reserve’s overall consumer inflation target. July marked the first annual increase in the PPI in more than a year.
The better-than-expected economic growth is perhaps the factor that drove the most notable shift in market and investor sentiment. The notion that the economy may avoid a recessionary period and may likely grow above trend this year seems to have been embraced by the markets. The Fed’s own GDP-Now forecasting tool is pointing to third-quarter U.S. GDP growth of a notable 4.1%. Towards the later part of 2023 to early 2024, some form of a rolling downturn could be possible. Parts of the economy, like manufacturing and housing, may stabilize while other economic segments, such as services, may soften. We may avoid a traditional hard recession of consecutive quarters of negative growth while still seeing a cooling in growth to below trend,
Metals and Mining
When opportunity costs are rising, few investors will prefer to hold an aggressive position in gold when they can get a 4% yield in short-term money markets, which explains the current weak investor demand in the gold market. Investors could expect to earn practically risk-free returns with short-term treasury bills with the growing expectations that the U.S. economy will see a soft landing. However, gold should not be written off as irrelevant as there is one segment of the marketplace that continues to accumulate gold. Central banks continue to buy gold because their faith in the U.S. dollar continues to weaken, despite demand being down from record levels since last year. Gold is a direct vote against the dollar, and fund managers expect central bank gold demand to continue to support gold prices and possibly drive them higher toward the end of the year.
Precious metals were generally down for the week. The spot price of gold ended at $1,913.76 per troy ounce, down by 1.50% from the previous week’s close at $1,942.91. Silver closed at $22.69 per troy ounce, a loss of 3.98% from its close last week at $23.63. Platinum’s spot price ended this week at $916.07 per troy ounce, down by 1.07% from last week’s close at $925.95. Palladium bucked the trend to end at $1,299.07 per troy ounce, gaining 3.07% over last week’s close at $1,260.35. The three-month LME prices of base metals have also gone down. Copper, which ended the previous week at $8,611.00, closed this week at $8,386.00 per metric ton, down by 2.61%. Zinc, previously priced at $2,485.00, closed this week at $2,457.00 per metric ton, down by 1.13%. Aluminum, which ended the week earlier at $2,230.00, ended this week at $2,204.00 per metric ton for a loss of 1.17%. Tin, previously priced at $28,023.00, closed this week at $26,885.00 per metric ton for a decline of 4.06%.
Energy and Oil
As physical tightness was felt across all continents, backwardation in Brent and WTI futures continued. However, a large U.S. inventory build and China’s uncertain outlook have capped oil prices. ICE Brent was trading at $86.44 per barrel and WTI maintained below $83 per barrel as of Friday morning. The market sentiment was sought to be influenced by international organizations as the IEA lowered its 2024 demand forecast by 150,000 barrels per day (b/d) even as OPEC raised its oil demand outlook over the next year. OPEC reiterated its upbeat forecast, announcing that it expects its global crude consumption to rise by 2.25 million b/d. This compares to a growth of 2.44 million b/d this year, concurrently increasing this year’s GDP growth forecast to 2.7% from 2.6%. Price stagnation has continued to prevail over the market at the moment.
Natural Gas
Global liquefied natural gas (LNG) import capacity is expected to grow by 16%, or 22.8 billion cubic feet per day, from 2023 to 2024, compared to 2022. Import capacity, also known as regasification capacity, grew as three countries (Germany, the Philippines, and Vietnam) began importing LNG for the first time in the first seven months of 2023. Antigua and Barbuda, Australia, Cyprus, and Nicaragua are expected to begin LNG importation for the first time by the end of next year, while several other countries are in advanced stages of developing LNG import capacity. Asia will lead the growth in global regasification capacity, accounting for 52% of the total capacity additions in 2023-2024. Europe will account for 38% and other countries for 10%.
For this report week beginning Wednesday, August 2, and ending Wednesday, August 9, 2023, the Henry Hub spot price rose by $0.48 from $2.43 per million British thermal units (MMBtu) to $2.91/MMBtu. The last time the Henry Hub traded above $2.90/MMBtu was when it traded at $3.08/MMBtu on January 25, 2023. The price of the September 2023 NYMEX contract increased by $0.482, from $2.477/MMBtu at the start of the report week to $2.959 at the end of the week. The price of the 12-month strip averaging September 2023 through August 2024 futures contracts rose by $0.308 to $3.472/MMBtu.
International natural gas futures prices ascended for this report week. The weekly average front-month futures prices for LNG cargoes in East Asia increased by $0.07 to a weekly average of $10.98/MMBtu. Natural gas futures for delivery at the Title Transfer Facility (TTF) in the Netherlands, the most liquid natural gas market in Europe, increased by $1.42 to a weekly average of $10.35/MMBtu. The corresponding prices for the same week last year (the week from August 3 to August 10, 2022) were $44.61/MMBtu in East Asia and $59.16/MMBtu at the TTF.
World Markets
In Europe, stocks ended little changed. The pan-European STOXX Europe 600 Index moved sideways while major stock indexes in the region were mixed. Germany’s DAX fell by 0.75%, the UK’s FTSE 100 Index declined by 0.53%, while Italy’s FTSE MIB dropped by 1.09%. France’s CAC 40 Index, on the other hand, climbed by 0.34%. The lackluster trading week was attributed to increasing concerns about a potential economic slowdown in China and the Italian government’s decision to seek a windfall tax on bank profits. As investors weighed the possibility that inflationary pressures might remain elevated, European government bond yields rebounded from intraweek lows. The yield on the benchmark 10-year German government bond rose above 2.50%, while Swiss and French bond yields range-traded within a narrow margin. The benchmark 10-year U.K. government bond yield ticked higher as expectations were raised that the Bank of England would continue to tighten monetary policy on the back of strong economic growth data.
Japan’s equities markets climbed over a holiday-shortened week. The Nikkei 225 Index gained approximately 0.9% while the broader TOPIX Index rose by about 1.3%. A favorable backdrop was provided by optimistic earnings forecasts from some major Japanese companies. Meanwhile, tourism-related shares were boosted by news that China would soon approve the resumption of Japan-bound group tours for its citizens. The yield on the 10-year Japanese government bond (JGB) dipped to 0.58% from a nine-year high of 0.65% attained at the end of the preceding week. The yen weakened to about JPY 144.6 against the U.S. dollar, from around JPY 141.7 the week before. The currency continues to be weighed down by Japan’s interest rate differential with the U.S. as the Bank of Japan (BoJ) maintains its ultra-accommodative stance.
China’s stock markets retreated as investor sentiment reacted to mounting evidence that the country’s recovery may have already peaked. The Shanghai Stock Exchange Index slumped by 3.01% while the blue-chip CSI 300 plummeted by 3.39%. The Hong Kong benchmark Hang Seng Index lost 2.38%. According to China’s inflation data, consumer and producer prices fell in tandem for the first time since November 2020, highlighting the weak demand throughout the economy. The CPI slid by 0.3% in July year-on-year and moved into contraction territory for the first time since February 2021. The PPI fell by 4.4% year-on-year which was worse than expected, but slowed down from its June decline of 5.4%. The data reinforced concerns that China’s economy had entered a deflationary period, which offset optimism about the government’s latest efforts to shore up demand. The State Council announced last month new measures to boost consumer spending which temporarily spurred hopes of stronger demand.
The Week Ahead
The important economic data expected to be released in the coming week include retail sales data, leading economic indicators, and the FOMC minutes from the July meeting.
Key Topics to Watch
- U.S. retail sales
- Retail sales minus autos
- Import price index
- Import price index minus fuel
- Empire State manufacturing survey
- Business inventories
- Minneapolis Fed President Kashkari speaks
- Housing starts
- Building permits
- Industrial production
- Capacity utilization
- FOMC minutes of July meeting
- Initial jobless claims
- Philadelphia Fed manufacturing survey
- U.S. leading economic indicators
Markets Index Wrap Up