Archives for January 6, 2019

It’s time to buy stocks again, these encouraging signs are telling strategists

Oppenheimer’s Wald: The worst of the selloff is behind the market

And just like that, the bulls came charging back.

All it took was one stellar economic data point to change the stock market’s mood and punt the indexes higher. But even before the robust jobs numbers exorcised the demons, strategists had started to predict that the market is gearing up for a comeback given the depth of the recent selloff.

“We expect a bear market rally to develop over the coming weeks, and we expect a new bull market to develop over the coming months to quarters,” said Ari Wald, a technical analyst at Oppenheimer & Co.

Wald believes the recent spate of weakness is the cyclical bear market waking up in the midst of a secular bull market and suggested that the selling pressure will soon work itself out.

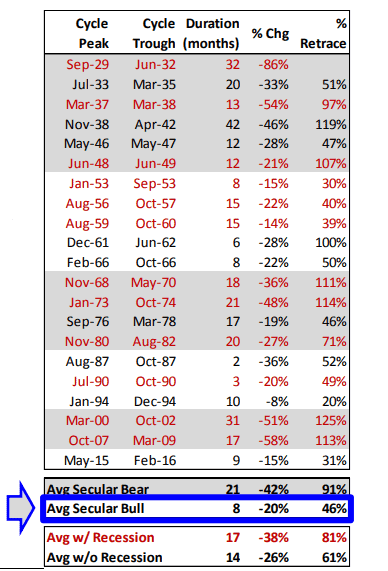
“On average, the index drops 20% over an 8-month period and retraces 50% of the prior advance,” he said. “This is why we believe the S&P 500 has endured the bulk of the magnitude and now requires time to base.”

The strategist forecast the S&P 500 to trade in a range of 2,375 to 2,700 for 2019.

The stock market closed out the first week of 2019 on a positive note, with the S&P 500 SPX, +3.43% rising 1.9%, the Dow Jones Industrial Average DJIA, +3.29% climbing 1.6% and the Nasdaq COMP, +4.26% rallying 2.3%, thanks to the strong jobs data which assuaged concerns of a slowdown in the U.S. economy and laid to rest fears about a looming recession.

Tobias Levkovich, chief U.S. equity strategist at Citi, who trimmed his 2019 target for the S&P 500 to 2,850 from 3,000, believes this is a good time to jump back into the market, in part given that stocks have the potential to rise 16% over the next 12 months on valuations alone.

Since the S&P 500’s record high in September, the large-cap index has tumbled double digits, making stocks much more affordable.

“Nothing is guaranteed, but the data suggest that we should be buying into current weakness,” he said.

Aside from affordability, there are other encouraging signs, according to strategists at Bank of America Merrill Lynch.

The bank’s Bull & Bear Indicator fell to 1.8, indicating “extreme bear,” triggering a buy signal for risky assets like stocks for the first time since June 2016 when markets were battered by Brexit headlines.

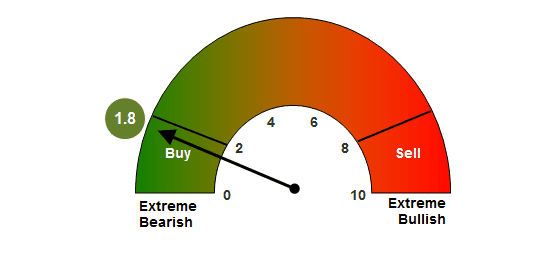
Historically, global stocks rose 6.1% in the three months following each of the buy signals triggered going back to 2000.

The next two critical signs to watch for are “policy panic” and a deterioration in profit expectations from the current 7.5% growth.

Tommy Ricketts, investment strategist at Bank of America Merrill Lynch, characterized policy panic as when central banks, especially the Federal Reserve, are unnerved enough by the financial markets to abandon their hawkish stance.

“Markets require a dovish pause at the very least,” he said.

That is a bold call to make in light of the blowout jobs report which has again raised expectations for the central bank to follow through on its interest-rate-hike agenda even as Chairman Jerome Powell reiterated Friday that the Fed will remain flexible.

Meanwhile, Ricketts thinks earnings outlooks still remain too lofty.

“We expect profit expectations to reset to 0-5% for 2019 driven by weak Asian exports, yield curve inversion, contracting monetary supply,” he said.

Analysts have lowered their S&P 500 fourth-quarter earnings estimate by 3.8% to $40.93 a share, significantly above the average cut of 3.1% over the past five years, according to John Butters, senior earnings analyst at FactSet.

Fourth-quarter earnings are expected to start trickling in next week with Bed, Bath & Beyond Inc. BBBY, +4.00% Target Corp. TGT, +1.37% Lennar Corp. LEN, +4.20% and KB Home KBH, +5.35% in the spotlight.

On the economic front, investors will have a slew of data to digest including the December ISM nonmanufacturing index, weekly jobless claims and the consumer price index.

Crypto projects promise decentralisation — the data shows that’s far from true

In the hands of the few: most crypto coins are held by just a small number of wallets.

Cryptocurrency projects trying to build decentralised networks are still controlled by a select few, new data suggests, calling into question their reason for using crypto technology to begin with.

Across the top 50 cryptocurrencies by trading volume, an average of 78% of all coins are held by the top 20 wallets, according to analysis by Token Analyst for Yahoo Finance UK. In 16 cases, the 20 biggest wallets hold more than 90% of total token supply.

The majority of these crypto tokens were issued to fund new startups and will be used in the projects they are building. Most of them promised some form of decentralisation. Vitalik Buterin, one of the founders of ethereum and a key crypto commentator, said in a blog post that decentralisation is “often even viewed as a blockchain’s entire raison d’être.”

Token Analyst’s data, which was compiled this week, shows that most projects are far from achieving their decentralise vision.

Jai Prasad from Token Analyst told Yahoo Finance UK it suggests that many projects are either failing to gain traction or did not need to use cryptocurrency technology for their ideas in the first place.

What is decentralisation and why does it matter?

Decentralisation is one of the key tenants of cryptocurrencies and crypto startups. To understand why, think about bitcoin.

With, say, sterling or dollars there’s a central bank that controls the supply of money and ultimately controls the financial system. But bitcoin has no central authority — the system works because of a loose, ever changing band of companies and individuals get together to do the legwork needed for it to operate. They are incentivised to do so by the reward of new bitcoin.

The advantage of this system is twofold. First, it should be more resilient. In the central bank system, a hacker could bring down the system by targeting the Bank of England or the Federal Reserve. With bitcoin, if one so-called ‘node’ in the system is taken down, another company or individual can simply step in to take its place.

The second advantage is that bitcoin is “censorship-resistant,” to use crypto parlance. This means it is not vulnerable to the changing whims of a controlling party.

A central bank could decide to flood the economy with new money — as many did in the wake of the 2008 financial crisis — and as a result devalue many people’s savings and salaries. Or it could block a company or whole country from its financial system, as the US has done with Iran.

Unilateral decisions like this are impossible with bitcoin. Because it is run by a coalition of parties, the majority must agree on any major changes to the system. This, in theory, should make it harder to “censor” against the wishes of users.

“The primary advantage of Bitcoin and Ethereum over their legacy alternatives is widely understood to be decentralization,” the CTO of Coinbase, one of the biggest cryptocurrency exchanges, wrote in a blog post exploring the topic.

‘The tokens are used purely for speculation’

Just as bitcoin created a decentralised payment network, many other startups have sprung up hoping to create similar decentralised applications, or dApps in the industry jargon. They cover everything from decentralised online storage to platforms to build blockchain-based games.

In order to decentralise, crypto tokens need to be held by a wide number of people who have buy-in to the project and idea.

However, the analysis for Yahoo Finance UK by startup Token Analyst suggests that many of these new projects are centralised in the hands of a small number of people and companies.

Token Analyst looked at the distribution of tokens from the top 50 ERC20 tokens — a format of crypto token associated with crypto startups largely created in the last two years. The analysis included high-profile projects such as Binance Coin, 0x, Maker Token, and Augur.

Across these projects, the top 20 digital wallets for each hold an a combined 77% of the total supply on average.

Token Analyst’s Prasad said that the figures were likely boosted by the fact that many crypto investors hold their tokens on crypto exchanges, rather than opening their own wallets. That means the digital wallets of exchanges will be swelled by the holdings of many of their customers.

However, Prasad said the fact people are leaving tokens on exchanges is a bad sign for the health of the projects, as it suggests many are simply using the tokens to speculate rather than using the networks they are built to be used on.

“If 20 addresses (including the token team and exchanges) own 80% of the tokens, this tells me a few things: 1. Pre-sale investors got in early at large discounts; 2. No one is interested in using the network and the tokens are used purely for speculation; and 3. future governance (crypto buzzword) will be at the beck and call of few,” Prasad said.

“Other than a dilution-free fundraising tool, the goal of an ICO is to incentivise different actors to participate in the network the ICO is building via the use of a token. The promise is that token holders will also have sway in the future development of the network — the governance.”

If just a few wallets hold over 50% of the total supply of tokens, they will likely be able to force through changes in the network.

“In my opinion, the most important characteristics of crypto networks are being ‘permission-less’ and ‘censorship-resistant’; anyone can use the network and anyone build on top of it,” Prasad said. “Without these properties, we probably don’t need a crypto network to begin with.”

Stocks to watch: Eyes on Twenty-First Century Fox, INC. (FOX), The Home Depot, INC. (HD)

The last few days have been rough for Twenty-First Century Fox, Inc. (NASDAQ:FOX), as its price has decreased by -0.74% during the week. It has also performed better over the past three months, as it added around 2.17% while it has so far climbed around 33.43% during the course of a year. The price of the stock went down by -$0.29 now trading at $47.18. Their shares witnessed a 39.79% increase from the 52-week low price of $33.75 they recorded on 2018-02-09. Even though it is still -5.24% behind the $49.65 high touched on 2018-06-29. The stock of FOX recorded -1.26% downtrend from the beginning of this year till date. The 12-month potential price target for Twenty-First Century Fox, Inc. is set at $51.5. This target means that the stock has an upside potential to increase by 9.16% from the current trading price.

When giving their opinion, around 52% of Wall Street analysts, which represents 13 out of 25 rated the stock as a Buy. 12 brokerage firms of the remaining 48% rated the stock as a Hold with 0 analyst rating it as a sell. Overall, the number of aggregate FOX shares held by institutional investors represents 58.45% of total shares. 60 institutions entered new Twenty-First Century Fox, Inc. (NASDAQ:FOX) positions, 252 added to their existing positions in these shares, 171 lowered their positions, and 40 exited their positions entirely.

Twenty-First Century Fox, Inc. (FOX) trade volume has increased by 17.75% as around 6,416,431 shares were sold when compared with its 50-day average volume of traded shares which is 5,449,276. At the moment, FOX is witnessing a downtrend, as it is trading -2.23% below its 20-day SMA, -0.7% below its 50-day SMA, and 8.5% below its 200-day SMA. The company runs an ROE of roughly 0%, with financial analysts predicting that their earnings per share growth will be around 9% per annum for the next five year. This will be compared to the 0% decrease witnessed over the past five years.

The first technical resistance point for Twenty-First Century Fox, Inc. (NASDAQ:FOX) will likely come at $47.55, marking a 0.78% premium to the current level. The second resistance point is at $47.92, about 1.54% premium to its current market price. On the other hand, inability to breach the immediate hurdles can drag it down to $46.48, the lower end of the range. FOX’s 14-day MACD is -0.3 and this negative figure indicates a downward trading trend. The company’s 14-day RSI (relative strength index) score is 42.81, which shows that its stock has been neutral. The 20-day historical volatility for the stock stands at 16.44 percent, which is high when compared to that of the 50-day’s 14.96 percent.

The shares of The Home Depot, Inc. (NYSE:HD) has decreased by -2.2%, and now trading at $168.61 on the Wall Street in the intra-day deal, with their shares traded now around 4,788,383. This is a decline of -1,422,549 shares over the average 6,210,932 shares that were traded daily over the last three months. The stock that is trading at $168.61 went higher by 6.65% from its 52-week low of $158.09 that it attained back on 2018-12-24. The stock recorded a 52-week high of $215.43 nearly 114 days ago on 2018-09-12.

HD stock hasn’t performed well over the past 30 days, as it lost -6.49% while its price plunged by -1.87% year-to-date (YTD). Looking at the last few days, it has been good for the stock, as it rose 0.2% over the last week. The stock’s 12-month potential target price is now at $204.79. This means that the stock price might likely increase by 21.46% from its current trading price.25 out of 35 Wall Street analysts which represents 71.43% rated the stock as a buy while the remaining 28.57 rated it as a hold, with 0 of analysts rating it as a sell.

The Home Depot, Inc. (NYSE:HD) has been utilizing an ROE that is roughly 652.6%, with stock analysts predicting that the company’s EPS for the next five years will go up by 14.09% per year, following the 20.5% raise that was witnessed during the past five years. The stock at the moment is on a downtrend, trading -1.15% below its 20-day SMA, -3.52% below its 50-day SMA, and -10.53% below its 200-day SMA. In percentage terms, the aggregate The Home Depot, Inc. shares held by institutional investors is 72.2%. 105 institutions jumped in to acquire The Home Depot, Inc. (HD) fresh stake, 936 added to their current holdings in these shares, 999 lowered their positions, and 72 left no stake in the company.

The stock’s 9-day MACD is 3.79 and this positive figure indicates an upward trading trend. The company’s 9-day RSI score is 47.11, which shows that its stock has been neutral. The 20-day historical volatility for the shares stand at 34.89 percent, which is more when compared to that of the 50-day’s 29.21 percent. On the daily chart, we see that the stock could reach the first level of resistance at $170.9, sporting a 1.34% premium to the current level. The next resistance point is at $173.18, representing nearly 2.64% premium to the current market price of The Home Depot, Inc. (HD). On the other hand, failure to breach the immediate hurdles can drag it down to $165.92, the lower end of the range.

Stocks to watch: Eyes on TAL Education Group (TAL), Royal Caribbean Cruises LTD. (RCL)

The last few days have been rough for TAL Education Group (NYSE:TAL), as its price has decreased by -7.07% during the week. It has also performed poorly over the past three months, as it lost around -1% while it has so far retreated around -18.3% during the course of a year. The price of the stock went down by -$1.26 now trading at $24.73. Their shares witnessed a 17.31% increase from the 52-week low price of $21.08 they recorded on 2018-10-11. Even though it is still -92.6% behind the $47.63 high touched on 2018-06-12. The stock of TAL recorded -7.31% downtrend from the beginning of this year till date. The 12-month potential price target for TAL Education Group is set at $34.14. This target means that the stock has an upside potential to increase by 38.05% from the current trading price.

When giving their opinion, around 75.86% of Wall Street analysts, which represents 22 out of 29 rated the stock as a Buy. 7 brokerage firms of the remaining 24.14% rated the stock as a Hold with 0 analyst rating it as a sell. Overall, the number of aggregate TAL shares held by institutional investors represents 10.57% of total shares. 37 institutions entered new TAL Education Group (NYSE:TAL) positions, 151 added to their existing positions in these shares, 154 lowered their positions, and 70 exited their positions entirely.

TAL Education Group (TAL) trade volume has decreased by -35.61% as around 3,093,352 shares were sold when compared with its 50-day average volume of traded shares which is 4,803,750. At the moment, TAL is witnessing a downtrend, as it is trading -8.86% below its 20-day SMA, -9.62% below its 50-day SMA, and -24.97% below its 200-day SMA. The company runs an ROE of roughly 16.3%, with financial analysts predicting that their earnings per share growth will be around 40.14% per annum for the next five year. This will be compared to the 37.1% increase witnessed over the past five years.

The first technical resistance point for TAL Education Group (NYSE:TAL) will likely come at $25.65, marking a 3.59% premium to the current level. The second resistance point is at $26.58, about 6.96% premium to its current market price. On the other hand, inability to breach the immediate hurdles can drag it down to $23.74, the lower end of the range. TAL’s 14-day MACD is -0.72 and this negative figure indicates a downward trading trend. The company’s 14-day RSI (relative strength index) score is 37.04, which shows that its stock has been neutral. The 20-day historical volatility for the stock stands at 39.91 percent, which is low when compared to that of the 50-day’s 58.67 percent.

The shares of Royal Caribbean Cruises Ltd. (NYSE:RCL) has decreased by -5.36%, and now trading at $92.55 on the Wall Street in the intra-day deal, with their shares traded now around 2,806,781. This is a rise of 852,435 shares over the average 1,954,346 shares that were traded daily over the last three months. The stock that is trading at $92.55 went higher by 3.43% from its 52-week low of $89.48 that it attained back on 2018-12-24. The stock recorded a 52-week high of $135.65 nearly 340 days ago on 2018-01-29.

RCL stock hasn’t performed well over the past 30 days, as it lost -18.15% while its price plunged by -5.36% year-to-date (YTD). Looking at the last few days, it has been tough for the stock, as it tumbled -2.03% over the last week. The stock’s 12-month potential target price is now at $137.21. This means that the stock price might likely increase by 48.25% from its current trading price.16 out of 20 Wall Street analysts which represents 80% rated the stock as a buy while the remaining 20 rated it as a hold, with 0 of analysts rating it as a sell.

Royal Caribbean Cruises Ltd. (NYSE:RCL) has been utilizing an ROE that is roughly 16.4%, with stock analysts predicting that the company’s EPS for the next five years will go up by 12% per year, following the 146.2% raise that was witnessed during the past five years. The stock at the moment is on a downtrend, trading -9.22% below its 20-day SMA, -12.46% below its 50-day SMA, and -17.74% below its 200-day SMA. In percentage terms, the aggregate Royal Caribbean Cruises Ltd. shares held by institutional investors is 73.8%. 93 institutions jumped in to acquire Royal Caribbean Cruises Ltd. (RCL) fresh stake, 307 added to their current holdings in these shares, 316 lowered their positions, and 67 left no stake in the company.

The stock’s 9-day MACD is 1.31 and this positive figure indicates an upward trading trend. The company’s 9-day RSI score is 32.82, which shows that its stock has been neutral. The 20-day historical volatility for the shares stand at 47.51 percent, which is more when compared to that of the 50-day’s 41.69 percent. On the daily chart, we see that the stock could reach the first level of resistance at $95.95, sporting a 3.54% premium to the current level. The next resistance point is at $99.34, representing nearly 6.84% premium to the current market price of Royal Caribbean Cruises Ltd. (RCL). On the other hand, failure to breach the immediate hurdles can drag it down to $88.48, the lower end of the range.