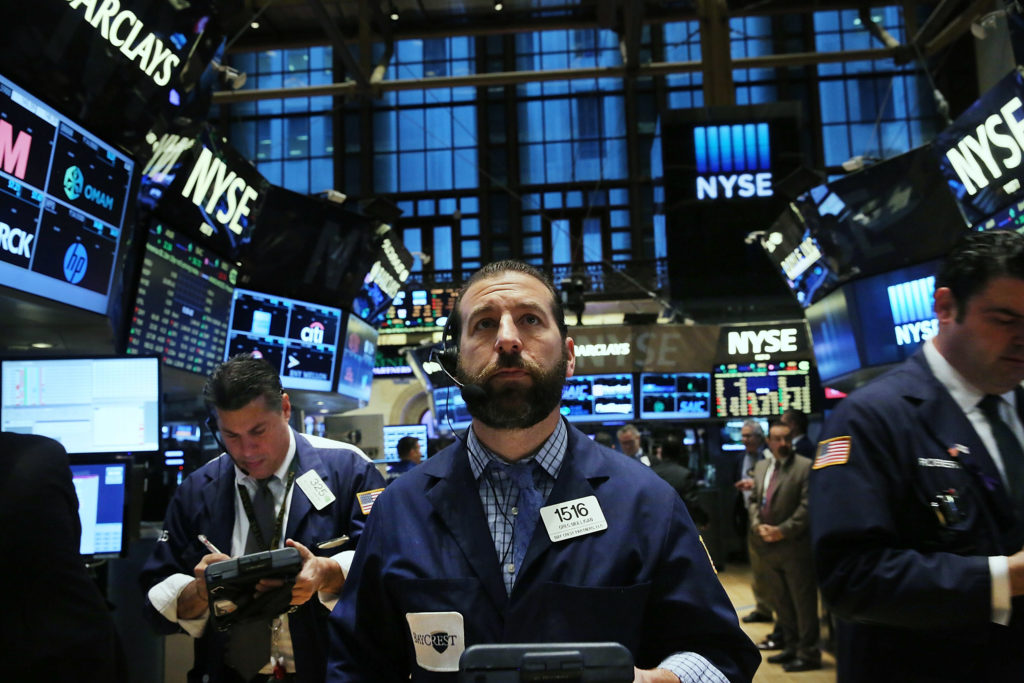
Ten years after the Lehman Brothers bankruptcy and the height of the financial crisis, the stock market is a very different creature.
The crisis profoundly affected stock trading, hurting some trading businesses while dramatically helping others. It accelerated some trends and stopped others in their tracks.
Here’s a few ways that trading has changed:
1. Less Liquidity:
The regulatory reform embedded in the 2010 Dodd-Frank law forced many banks to reduce, and in most cases, eliminate their proprietary trading operations and even curtail their agency business. “The restrictions placed up on investment bank trading desks and the inventory they could carry reduced market liquidity,” Mike O’Rourke, chief market strategist at Jones Trading, told CNBC.
Now, traders routinely complain that most markets seem to have fewer committed risk takers. And even though some of the most onerous aspects of the regulation have been repealed, traders note that banks haven’t yet raced back to fill that void.
As the pool of market makers shrank, other liquidity providers (high frequency traders) have stepped in to partially fill the void, and other exchange venues for stocks and options continued to proliferate. That fragmented liquidity even further.
2. Fewer IPOs:
The additional regulatory obligations created under Dodd-Frank made it difficult for companies to go public. After slowly recovering from the 2000 Dotcom bust, the number of IPOs plunged from 213 in 2007 to 31 in 2008. The IPO market didn’t really recover until 2013, when 222 companies went public, according to Statista.
But despite pent-up demand, the number of IPOs has remained relatively anemic. Excessively low interest rates (one of the long-term effects of the financial crisis) have made it possible for private equity companies to raise vast sums of money to throw at young companies that would have normally sought to tap the public markets.
There are several hundred tech “unicorns” with $1 billion-plus market valuations that have chosen to stay private and avoid the public markets.
3. Fewer stocks:
Fewer IPOs are only part of the reason the number of publicly traded stocks are shrinking. After rising for more than 20 years, the number of publicly listed stocks dropped dramatically after the dot.com bust, from roughly 7,500 in 1998 to about 5,000 in 2004, according to data compiled by University of Florida professor Jay Ritter. It was relatively stable for several years, but plunged again during the financial crisis, to about 4,300 in early 2009.
But then a funny thing happened. After the financial crisis was over, the number of publicly traded companies continued to drop. At the end of 2017, the Wilshire 5000 — a basket of the 5,000 largest stocks in the U.S. — had only 3,492 stocks in it.
That is less than half the publicly traded stocks there were in 1998.
4. Less volatility:
Central banks helped create the greatest trade of the post-financial crisis era: Go long equities, and short volatility. “A decade of global Central Bank coddling through ZIRP [Zero Interest Rate Policy], NIRP [Negative Interest Rate Policy] and central bank asset purchases stifled volatility and pushed up asset prices,” O’Rourke from Jones Trading said. “In March 2009 the S&P 500 market cap was $6.5 Trillion. The Fed, BOJ and ECB have purchased $10 Trillion of assets since the crisis.”
The result has been long periods of abnormally low volatility, punctuated by short bursts of panic (such as the European debt crisis in 2011, China’s currency devaluation in 2015 and the inflation worries in 2018).
5. Rise of ETFs:
The ETF trend started pre-2008, but ETFs fit the investing post-crisis investment psychology particularly well. “I think passive investing has definitely benefited from the financial crisis,” JJ Kinahan, the chief market strategist at TD Ameritrade, told CNBC. “That is, many feel that by not taking individual stock risk and using ETFs that their risk will be less.”
One of the lasting legacies of the 2008 crisis “is a residual skittishness among individual investors regarding risk and financial markets,” Steve Sosnick, the chief options strategist at Interactive Brokers, said. “As a decade has passed risk tolerance has improved, but many feel safer investing passively or pre-hedged instruments like ETFs. Even sectoral ETFs have an appeal under that mentality: I think that homebuilders/semiconductors/biotechs seem like a good investment, but I can simply buy the industry rather than guessing which ones are most likely to benefit.”
ETFs, which were almost exclusively tied to passive indexes, grew slowly but steadily throughout the early 2000s. Assets declined from 2007 to 2008 as investors pulled out, but then began taking off.
ETF assets under management
2008: $531Billion
2011: $1.05 Trillion
2013: $1.68 Trillion
2015: $2.10 Trillion
2017: $3.40 Trillion
Other effects:
Put it all together, and it means a drastically different Wall Street: “People are not making money in equity trading anymore,” said Patrick Healy, who advised many companies going public before and after as head of Issuer Advisory Group.
Dennis Kelleher, who runs Better Markets, a nonprofit advocacy organization promoting the public interest in the financial markets, also noted that the financial crisis had helped to accelerate trends already under way in market structure, including the growth of high frequency trading and the explosion of activity in the off-exchange trading sites called dark pools.
While the trading business has changed dramatically, none of this has meant the death of equities.
“If you look across asset classes and see where you can get a decent return, you can’t get any return in bonds, so stocks are the only asset game in town,” he said.


