Stock Markets
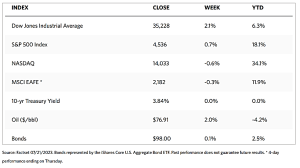
Stocks were mostly up over the past week as company earnings reports provided some buying motivation for investors. According to the WSJ Markets report, the Dow Jones Industrial Average (DJIA) rose by 2.08% while the total stock market index registered a 0.75% gain. The broad S&P 500 Index nudged up by 0.69% while the technology-heavy Nasdaq Stock Market Composite bucked the trend to fall slightly by 0.57%. The NYSE Composite gained 1.55%. The CBOE Volatility Index, a risk perception indicator, increased by 1.95%. The slump in technology shares accounted for the lower-than-expected quarterly results for Tesla and Netflix. On Thursday, Tesla plunged by 9.74%, its biggest single-day decline since April 20, after the company reported a drop in its second-quarter gross margins to its lowest in four years, followed by CEO Elon Musk’s announcement of more price cuts ahead. Netflix, on the other hand, tumbled by 8.41%, its biggest one-day percentage loss since December 15, after the company’s announcement that its quarterly revenues failed to meet estimates.
Overall, however, the big picture shows the resilience of equities as they continue to rally sharply off the October bear-market low. They have recovered the majority of their 26% decline between January and October 2022, as the S&P 500 Index ended within 6% of its all-time high. The earnings reports indicate that companies have adequately steered through high but falling inflation (due to labor and import costs) and strong but moderating demand due to sales. The run in the markets since May is attributable to increasing optimism that the economy may see a “goldilocks” phenomenon – that economic conditions are neither too hot to prevent inflation from further decline, nor too cold for a recession to take place. While this may be possible, caution is still warranted because the sharp market rally, up by 12% since May, may be premature, too much too soon, and a correction may be imminent.
U.S. Economy
This phase of the economic cycle may be set apart by the hitherto unconventional labor market which provides its pillar of support. The consumer-spending growth registered higher than 4% in the first quarter of this year, thanks mostly to half-century lows in unemployment and elevated wage growth. Household consumption seems to be the source of the economy’s growth since consumer spending growth rates have risen by more than double the overall GDP growth rate. While currently, the labor market remains robust, there are early signals that it is gradually softening. A credible leading indicator is initial jobless claims. Although it has not yet shown a collapse in employment, the three-week moving average in weekly initial jobless claims has risen by nearly 20% over the past six months. Some emerging fatigue is becoming evident based on the trends in jobless claims, labor turnover, and hourly earnings, which may become more evident in the second semester of this year. Unemployment may see a modest rise in the coming months, simultaneous with a slowdown in monthly job and wage gains, and finally culminating in slower consumer spending. This development will reduce much of the driving force behind GDP growth.
While the deceleration in personal consumption is likely to knock some of the wind out of the economy’s sails, other components of economic growth may start to pick up in the form of a “rolling recession” to support a gentler slowdown. Already starting to emerge are measurable downturns in housing activity, manufacturing, and business investment. There are also some encouraging early signs of production stabilization, and a rebound in residential investment may be likely, according to the latest reads on the housing market. Some resiliency in business spending is also likely as input and labor costs moderate. These developments may take place in time to offset the softening in consumer spending. Overall GDP may not plunge dramatically, although underlying areas of economic activity are undergoing recessionary conditions.
The markets may experience some positive impacts from a slowing economy. A softening in consumer spending may contribute to lowering the inflation rate, which in turn may cause the Federal Reserve to hold back and even reverse its restrictive monetary policy. The Fed may then be enticed to adopt interest rate cuts in 2023. In the meantime, though, the Fed will continue to focus on controlling inflation at the expense of economic momentum, possibly hiking interest rates by another 0.25% or a quarter point at its next meeting on July 26. Hopefully, rates will be held steady over the rest of the year.
Metals and Mining
There had been much excitement two weeks ago on news from Russian sources that the BRICS countries (Brazil, Russia, India, China, and South Africa) were on the verge of creating a gold-backs BRICS trading currency. This meant the creation of a new gold standard, according to speculators. The optimism was premature, however. South Africa’s ambassador to BRICS, Anil Sooklal, debunked the news that such an announcement was imminent. It is not surprising that the establishment of a gold-back trading currency was outrightly dismissed since many economists said that a new gold standard would be unrealistic. Such would disrupt economic stability through deflation. Nevertheless, gold is still seen to play an essential role as a monetary metal. In the press briefing, more than 40 countries have indicated an interest in joining BRICS, the block of major developing countries.
Over the past week, precious metals generally ended mixed. Gold ascended slightly by 0.34%, from its week-ago close at $1,955.21 to its recent weekly close at $1,961.94 per troy ounce. Silver ended 1.36% lower from its price during the previous week of $24.95 to its recent closing price of $24.61 per troy ounce. Platinum ended this week at $965.84 per troy ounce, lower by 1.07% from its previous price of $976.25. Palladium closed this week at $1,295.34 per troy ounce, 1.37% higher than last week’s close at $1,277.84. The three-month LME prices for base metals were mostly down for the week. Copper closed at $8,485.50 per metric ton, down by 0.17% from its week-go price of $8,673.50. Zinc ended this week at $2,383.50 per metric ton, lower by 2.28% from last week’s closing price of $ 2,439.00. Aluminum closed the week at $2,201.00 per metric ton, down by 3.32% from last week’s closing price of $2,276.50. Tin ended this week at $28,715.00 per metric ton, down by 0.33% from last week’s close at $28,809.00.
Energy and Oil
This week, U.S. SPR stocks saw their first replenishment in more than two weeks, simultaneous with another week-on-week decline in oil inventories (i.e. by a mere 0.7 million barrels of oil). Bullish indicators were capped by a strengthening U.S. dollar causing prices to trend sideways. Also weighing on the market was resurgent speculation regarding the upcoming OMC meeting of the Federal Reserve which is scheduled for the coming week. On the back of these developments, ICE Brent continues to hover around $80 per barrel and the WTI remains slightly above $76 per barrel. In local developments, the U.S. Senate, by a vote of 85-14, overwhelmingly decided in favor of an amendment to the annual defense bill that would ban exports of strategic petroleum reserves to China. Last year, the U.S. sold 2 million barrels of oil to Chinese buyers, a fraction of “normal” crude sales.
Natural Gas
For the report week that began on Wednesday, July 12, and ended on Wednesday, July 19, 2023, the Henry Hub spot price fell by $0.04 from $2.55 per million British thermal units (MMBtu) at the start of the week to $2.51/MMBtu at the end of the week. The price of the August 2023 NYMEX contract decreased by $0.029, from $2.632/MMBtu to $2.603 throughout the report week. The price of the 12-month strip averaging August 2023 through July 2024 futures contracts declined by $0.04 to $3.141/MMBtu.
Prices of international natural gas futures decreased during this report week. The weekly average front-month futures prices for liquefied natural gas (LNG) cargoes in East Asia decreased by $0.82 to a weekly average of $11.22/MMBtu. Natural gas futures for delivery at the Title Transfer Facility (TTF) in the Netherlands, the most liquid natural gas market in Europe, decreased by $1.12 to a weekly average of $8.67/MMBtu. In the corresponding week last year (the week that began on July 13 and ended on July 20, 2022), the prices were $38.11/MMBtu and $47.59/MMBtu in East Asia and at the TTF, respectively.
World Markets
European stocks rose on Friday to bring the week’s trading up, together with major indexes. The pan-European STOXX Europe 600 Index gained by 0.95% in local currency terms. A generally optimistic sentiment prevailed on evidence that inflation was gradually slowing, leading investors to speculate that the slowdown may eventually herald the end of monetary policy tightening, Major indexes arrived at modest gains for the week. France’s CAC 40 Index rose by 0.79%, Italy’s FTSE MIB gained by 0.67%, and Germany’s DAX advanced by 0.45%. The UK’s FTSE 100 Index outperformed the other European indexes, surging by 3.08% for the week. This was partially attributed to the depreciation of the British pound against the U.S. dollar. The FTSE 100 Index includes many multinational companies with overseas revenues, and the depreciation is seen to nominally elevate these companies’ foreign revenues in pound sterling terms. European government bond yields inched lower due to the cooling of U.S. inflation, while the UK raised investor expectations that the major central banks are close to ending monetary tightening. Yields on Italy’s 10-year sovereign bonds dropped briefly below a one-month low of 4%. Yields on the 10-year government bonds in the UK declined also due to faster-than-expected slowing inflation. The European economy remained unchanged, avoiding an expected recession.
Japan’s stock markets were mixed for the week. The Nikkei 225 fell by 0.3% while the broader TOPIX index gained 1.0%. Investor sentiment was cautious ahead of the Bank of Japan’s (BoJ’s) monetary policy scheduled for July 27-28, slightly dampening expectations that Japan’s central bank would adjust its yield curve control (YCC) framework. A high June core consumer price inflation reading, while in line with expectations, somewhat pressured the BoJ to tighten its policy and adjust its inflation forecasts upward. The yield on the 10-year Japanese government bond thus rose slightly to 0.48% from the 0.47% yield at the end of the previous week. The yen softened to around JPY 141.82 against eh U.S. dollar from the prior week’s exchange rate at about JPY 138.76 to the greenback.
China’s stock markets pulled back for the week in reaction to the latest economic data pointing to a struggling economic recovery. The blue-chip CSI 300 declined by 1.98% while the Shanghai Stock Exchange Composite Index tumbled by 2.16% in local currency terms. Hong Kong’s benchmark Hang Seng Index fell by 1.74% from its level the previous week. China’s second-quarter gross domestic product (GDP) expanded by 6.3% year-over-year which, although faster than the 4.5% growth seen in the first quarter, fell below expectations. The economy grew by 0.8% quarterly, down from the 2.2% expansion recorded for the first quarter. The quarterly readings are more reliable than the year-on-year growth rates when gauging China’s underlying economic growth due to the distortionary effect of the pandemic lockdowns in Shanghai and other cities. Unemployment is steady at 5.2% in June, but youth unemployment shot up to a record 21.3%.
The Week Ahead
Important economic data expected to be released in the coming week include the Federal Open Market Committee (FOMC) meeting, the advanced GDP report, and personal consumption expenditure (PCE) data.
Key Topics to Watch
- S&P “flash” U.S. manufacturing PMI
- S&P “flash” U.S. services PMI
- S&P Case Shiller home price index (20 cities)
- Consumer confidence
- New home sales
- FOMC decision on interest rate policy
- Fed Chairman Powell press conference
- Initial jobless claims
- Durable goods orders
- Durable goods minus transportation
- GDP (advanced report)
- Advanced U.S. trade balance in goods
- Advanced retail inventories
- Advanced wholesale inventories
- Pending home sales
- Personal income (nominal)
- Personal spending (nominal)
- PCE index
- Core PCE index
- PCE (year-over-year)
- Core PCE (year-over-year)
- Employment cost index
- Consumer sentiment (final)
Markets Index Wrap Up