Archives for September 26, 2019

Volvo’s electric XC40 will be one of its safest vehicles yet

Battery power and new driver assists work in the SUV’s favor.

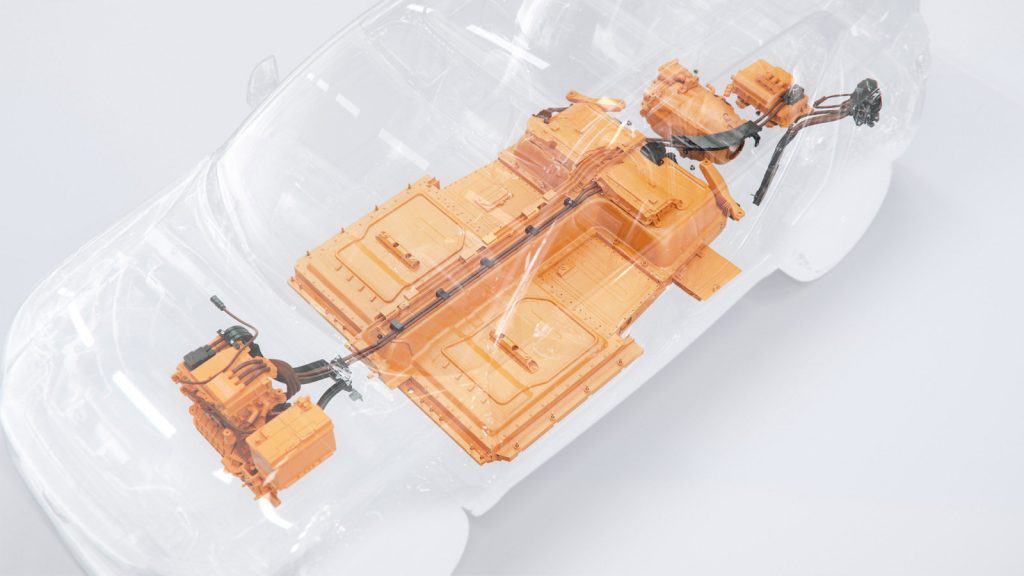
Volvo has been teasing an electric version of its XC40 SUV for a while, and now it’s ready to dribble out some information. The automaker is boasting that its first EV will be “one of the safest cars on the road” due both to its inherent design and new features. The presence of a battery in the floor of the vehicle helps lower the center of gravity and prevent rollovers, but there’s also a new battery structure with a safety cage and crumple zone to protect the lithium-ion cells in the event of a collision.

Volvo has also reinforced the front and back to both adapt to the lack of a gas engine (a given, really) and to distribute collision forces away from the cabin.

There’s also some tech that’s new to any Volvo — this is its first car with an Advanced Driver Assistance Systems array of cameras, radars and ultrasonic sensors. The company hasn’t gone into detail about how this will work, but it’s apparent the electric XC40 will be more aware of its surroundings.

You’ll have to wait a while if you want more tidbits. Volvo is planning to tease more details in the run-up to a public reveal on October 16th. Even at this stage, though, it’s evident that Volvo didn’t just slap a battery into the existing XC40. It’s treating this as a distinct model, even if there will be some obvious similarities.

Echo Loop hands-on: Alexa on your knuckles and at your fingertips

It’s Amazon’s experimental attempt at smart jewelry

Aside from a pair of glasses, Amazon also announced another interesting Alexa-powered wearable: a smart ring. The Echo Loop is a chunky piece of smart jewelry made out of titanium, with a tiny discreet button. In order to activate it, you have to press the button with your thumb, after which you can say the usual Alexa commands. It has a built-in microphone and speakers.

That sounds kind of cool, but in practice it was a little weird. I had to hold my hand up to my mouth to speak to it, and then bring my hand up to my ear in order to listen to it; I almost felt like I was in a goofy spy movie. The ring vibrates a little to let you know Alexa is listening, and whenever you get notifications. Just like the Echo Frames and the Echo Buds, you can tap and hold on the button to activate your phone’s voice assistant like Siri or Google Assistant.

Echo Loop

The Loop comes in small, medium, large and extra large, and Amazon says you can get a ring sizing kit to help you figure out which size is best for you. As for battery life, the company claims that it’ll last about a day, though one model we had for demo seem to run out of juice pretty quickly (admittedly it was under constant use).

Between the Frames and the Loop, I think the latter is a little harder proposition simply because of its chunky size and the fact that you look kinda crazy talking into it. The Frames seem much more appropriate, and might blend into your everyday life a lot better. That said, the Loop is also cheaper at $130 instead of $180.

As a “Day One” device, the Loop isn’t available widely just yet. It’s available only on a limited basis and you can only get one via a special invitation. If you do want one though, you can apply for it starting today.

Stocks to Watch: Marinemax Inc (HZO)

Stock Performance View

Tracking current trading session activity on shares of Marinemax Inc (HZO), we can see that the stock price recently hit 15.04. At the open, shares were trading at 14.55. Since the start of the session, the stock has topped out with a high of 15.08 and bottomed with a low of 14.51. After noting current price levels, we can see that the change from the open is presently  0.51.

Investors may be employing many various trading strategies when approaching the markets. Investors may be hoping for sustained upward trends where stocks calmly and steadily advance in that direction. Of course, this isn’t typically the case. Having some foreign exposure in the portfolio may provide overall diversification and also potentially boost performance over time. Investing globally may entail considering the risks of investing in economies that are inherently less developed and thus less liquid. A diversified approach may target foreign markets that have solid growth potential and favorable domestic conditions, such as a stable political setting. Investing globally may require much more research and dedication in order to fully understand the ins and outs.

Relative Strength

Investors may be tracking various technicals on shares of Marinemax Inc (HZO). We can see that the 9 day relative strength value is currently 53.64%. This technical momentum indicator compares the size of recent gains to recent losses helping to identify possible overbought and oversold conditions. The 9 day historical volatility reading is currently 37.23%. This measures the average deviation from the average price spanning the past 9 days. The current 9 day MACD has been spotted at -0.38. This value represents the difference between a short-term and a long-term moving average. A reading over zero may provide a bullish signal, and a value under zero may represent a bearish signal.

Focusing in on some other information, we can see that Marinemax Inc (HZO) has a current weighted alpha of -34.8. The weighted alpha gauges how much the stock has increased or decreased over the period of one full year. The weighting puts higher emphasis on more recent activity providing a more relevant measure for short-term technical analysts to use. A positive weighted alpha reading indicates that the stock has risen over the past year. A negative reading would indicate that the stock is down over that same time period. Technical traders often use the weighted alpha to help discover stocks that are building momentum.

Traders might be paying extra attention to the technicals as they look to spot buying opportunities in the stock market. Because there are so many different strategies that traders can use, it may be difficult to pinpoint the correct avenue. New traders might choose to focus on one or two main indicators when just starting out. With time and experience, many traders will use a combination of various indicators when setting up their persona charts. It may be wise for traders to remember that what has worked for someone else in the past may not work for them in the future.  

Earnings Focus

Marinemax Inc (HZO) last reported earnings results on 7/25/2019. For the most recent period, the company posted quarterly EPS of 0.84. The trailing 12 month earnings number is currently 1.73. The company’s EPS growth over the previous quarter clocks in at 265.22%. The EPS metric is frequently used to measure a company’s profitability based on each outstanding share of common stock.

Keeping watch on technicals may involve many different plans and scenarios. Investors may be seeking to get some clarity about a certain stock’s history, and eventually try to project the future. With so much historical data available, investors may choose to look at many different time frames when examining a stock. Going back days, months, of even years, may help broaden the scope and help investors see the bigger picture. When companies gear up to release the next round of quarterly earnings results, investors will be closely watching to see how profitable the overall quarter was. Occasionally, low expectations may provide ample impetus for future stock gains. Per usual, there will most likely be big winners and losers depending on the strength of the individual reports. 

Stocks to Watch: Actuant Corporation (NYSE:ATU)

Stock market investors may be closely tracking recent trends. Many investors will keep an eye on where a certain stock has been when trying to project where it is headed. Tracking recent action for Actuant Corporation (NYSE:ATU), we have seen shares trading close to the 24.35 mark. Taking a wider look back, shares have seen a change of -1.93% over the last 12 weeks. Heading back to the start of the year, we can see that shares have changed 16.01%. Over the past month, shares have seen a change of 14.64%. Over the last week, the stock has moved -7.03%. Taking a look at some popular possible support and resistance levels, we note that the 52-week high is currently 30.6, and the 52-week low is presently 19.36. When a stock price is trading close to the 52-week high or 52-week low, investors may closely track activity to watch for a move through the level.

As many veteran investors have already seen, market movements are extremely hard to accurately predict. Financial news outlets are always producing headlines and offering predictions for future market performance. Sometimes the predictions are right, and sometimes the predictions are wrong. Investors may have a hard time separating fact from fiction when it comes to bullish and bearish sentiment. Adjusting the portfolio based strictly on headlines can be tempting for the amateur investor. Filtering out the noise and focusing on the pertinent data can help keep the individual focused and on track. Straying from the plan and basing investment decisions on news headlines may lead to portfolio confusion down the road. Crunching the numbers and paying attention to the important economic data can greatly help the investor see through the smoke when markets get muddled.

Shifting the focus to some earnings data, we have noted that the current quarter EPS consensus estimate for Actuant Corporation (NYSE:ATU) is 0.15. This EPS estimate consists of 3 Wall Street analysts taken into consideration by Zacks Research. For the previous reporting period, the company posted a quarterly EPS of 0.45. Sell-side analysts often provide their best researched estimates at what the company will report. These estimates hold a lot of weight on Wall Street and the investing community. Sometimes these analyst projections are spot on, and other times they are off. When a company reports actual earnings results, the surprise factor can cause a stock price to fluctuate. Investors will often pay added attention to a company that has beaten estimates by a large margin.

Looking at some analyst views on shares of Actuant Corporation (NYSE:ATU), we note that the consensus target price is resting at $23.2. This is the consensus target using estimates provided by the covering analysts polled. Sell-side analysts often produce target estimates for the companies that they track closely. Price target estimates can be calculated using various methods, and this may cause some analyst estimates to be drastically different than others. Many investors will track stock target prices, especially when analysts update the target price projections.

Investors might be paying attention to what Wall Street analysts think about shares of Actuant Corporation (NYSE:ATU). Taking a peek at the current consensus broker rating, we can see that the ABR is 3. This average rating is provided by Zacks Research. This simplified numeric scale spans the range of one to five which translates brokerage firm Buy/Sell/Hold recommendations into an average broker rating. A low number in the 1-2 range typically indicates a Buy, 3 indicates a Hold and 4-5 represents a consensus Sell rating. In terms of the number of analysts that have the stock rated as a Buy or Strong Buy, we can see that the number is currently 1.

As we move closer towards the end of the year, investors may be undertaking a portfolio review. Reviewing trades over the past six months, investors should be able to see what has worked and what has not. There might be some stocks that have outperformed the market, and there might be some underperformers as well. Focusing on what has worked so far this year may help provide a clearer picture for future moves. Pinpointing what went wrong can also help the investor see which areas of the portfolio need improvement. If the stock market continues on to reach new heights, investors might be looking to lock in some profits before making the next big trade.

Stocks to Watch: Covanta Holding Corporation (NYSE:CVA)

Looking back at some historical performance on shares of Covanta Holding Corporation (NYSE:CVA), we can see that the stock price performance for the last week is 1.72%. Tracking back further over the past month, the stock has performed 5.91%. For the last quarter, shares have performed -1.28%. Going back to the start of the calendar year, company shares are 32.12%. If we scroll back to the full year reading, shares have performed 5.22%. Investors may be trying to figure out if it is a good time to get into a certain stock, or whether to exit a position that has been a loser. Whatever the case, outperforming the market is on the minds of many dedicated equity investors.

For technical traders, support and resistance lines play an important role. The support line generally displays the lowest price that investors will let a stock trade. This means that the stock price is unlikely to drop under this level. When support lines are breached, chartists may be watching for shares to move lower until they reach the next support level. The resistance line is the exact opposite of the support line. The resistance level is typically the highest price that investors will allow the stock to trade at. Traders will carefully watch the stock price when a resistance level is broken. The thought is that the price will continue to move towards the next level of resistance. Traders and investors may use support and resistance lines for various purposes. One popular use of these lines is to identify possible entry and exit points for trades.

We can now shift our focus to some alternate company data on shares of Covanta Holding Corporation (NYSE:CVA). The stock has a current ATR of 0.35. When applying indicators for technical analysis, traders and investors may choose to examine the ATR or average true range. The ATR measures the volatility of a stock on a day-to-day basis. The average true range is typically based on 14 periods and may be calculated daily, weekly, monthly, or intraday. The ATR is not considered a directional indicator, but it may reflect the strength of a particular move. As we move into the second half of the year, investors may be looking to jumpstart their portfolios. Many equity investors may be wondering if the stock markets will find renewed energy and continue higher, or if a major correction is on the horizon.

Shares of Covanta Holding Corporation (NYSE:CVA) have been recently spotted trading -4.08% off of the 52-week high price. On the other end, company shares have been noted 36.46% away from the low price over the last 52-weeks. Switching over to some distances from popular moving averages, we see that the stock has been recorded 4.57% away from the 200 day moving average. Moving closer, we can see that shares have been trading 2.04% off of the 20-day moving average. Investors may be closely following the current stock price in relation to moving averages. This may assist with figuring out if a breakout or reversal could be in the cards. Knowing when to ride the surge rather than stay on the sidelines, can be a difficult decision even for veteran investors.

Focusing on some other company information, we can see that Covanta Holding Corporation (NYSE:CVA) has a beta of 1.34. Beta indicates the tendency of a stock’s returns to respond to market swings. A beta of 1 indicates that the stock price moves with the market. A beta under 1 indicates that the stock is less volatile than the market in theory. A beta value over one would indicate the opposite. In terms of volatility, shares have been noted at 1.98% for the week, and 2.02% for the past month. Investors often keep a close eye on any irregular stock volume. Traders and technical analysts have the ability to use volume to help measure the strength of a particular move. Investors may also view volume levels when the stock price is nearing significant support or resistance levels, in order to confirm a breakout in either direction.

Stock market players may have differing opinions on which type of research approach is best. Individual investors who prefer buy and hold strategies may be more likely to be studying the fundamentals. Traders that are constantly buying and selling shares may be more concerned with technical analysis. High frequency traders may be willing to take on more risk entering the market. For these types of traders, entry and exit points become far more important. Traders may be relying solely on charts in order to capture profits based on day to day, hour to hour, or minute by minute price fluctuations. Long term investors may not be as concerned with the daily ups and downs of the market.

Stocks to Watch: Holly Energy Partners, L.P. (NYSE:HEP)

Looking back at some historical performance on shares of Holly Energy Partners, L.P. (NYSE:HEP), we can see that the stock price performance for the last week is -1.10%. Tracking back further over the past month, the stock has performed -8.32%. For the last quarter, shares have performed -7.51%. Going back to the start of the calendar year, company shares are -11.59%. If we scroll back to the full year reading, shares have performed -23.76%. Investors may be trying to figure out if it is a good time to get into a certain stock, or whether to exit a position that has been a loser. Whatever the case, outperforming the market is on the minds of many dedicated equity investors.

For technical traders, support and resistance lines play an important role. The support line generally displays the lowest price that investors will let a stock trade. This means that the stock price is unlikely to drop under this level. When support lines are breached, chartists may be watching for shares to move lower until they reach the next support level. The resistance line is the exact opposite of the support line. The resistance level is typically the highest price that investors will allow the stock to trade at. Traders will carefully watch the stock price when a resistance level is broken. The thought is that the price will continue to move towards the next level of resistance. Traders and investors may use support and resistance lines for various purposes. One popular use of these lines is to identify possible entry and exit points for trades.

We can now shift our focus to some alternate company data on shares of Holly Energy Partners, L.P. (NYSE:HEP). The stock has a current ATR of 0.77. When applying indicators for technical analysis, traders and investors may choose to examine the ATR or average true range. The ATR measures the volatility of a stock on a day-to-day basis. The average true range is typically based on 14 periods and may be calculated daily, weekly, monthly, or intraday. The ATR is not considered a directional indicator, but it may reflect the strength of a particular move. As we move into the second half of the year, investors may be looking to jumpstart their portfolios. Many equity investors may be wondering if the stock markets will find renewed energy and continue higher, or if a major correction is on the horizon.

Shares of Holly Energy Partners, L.P. (NYSE:HEP) have been recently spotted trading -24.48% off of the 52-week high price. On the other end, company shares have been noted 2.44% away from the low price over the last 52-weeks. Switching over to some distances from popular moving averages, we see that the stock has been recorded -10.50% away from the 200 day moving average. Moving closer, we can see that shares have been trading -5.16% off of the 20-day moving average. Investors may be closely following the current stock price in relation to moving averages. This may assist with figuring out if a breakout or reversal could be in the cards. Knowing when to ride the surge rather than stay on the sidelines, can be a difficult decision even for veteran investors.

Focusing on some other company information, we can see that Holly Energy Partners, L.P. (NYSE:HEP) has a beta of 0.72. Beta indicates the tendency of a stock’s returns to respond to market swings. A beta of 1 indicates that the stock price moves with the market. A beta under 1 indicates that the stock is less volatile than the market in theory. A beta value over one would indicate the opposite. In terms of volatility, shares have been noted at 3.23% for the week, and 2.93% for the past month. Investors often keep a close eye on any irregular stock volume. Traders and technical analysts have the ability to use volume to help measure the strength of a particular move. Investors may also view volume levels when the stock price is nearing significant support or resistance levels, in order to confirm a breakout in either direction.

Stock market players may have differing opinions on which type of research approach is best. Individual investors who prefer buy and hold strategies may be more likely to be studying the fundamentals. Traders that are constantly buying and selling shares may be more concerned with technical analysis. High frequency traders may be willing to take on more risk entering the market. For these types of traders, entry and exit points become far more important. Traders may be relying solely on charts in order to capture profits based on day to day, hour to hour, or minute by minute price fluctuations. Long term investors may not be as concerned with the daily ups and downs of the market.