Archives for April 22, 2019

SpaceX Crew Dragon capsule suffers ‘anomaly’ in testing

A Falcon 9 SpaceX rocket, ready for launch, sits on pad 39A at the Kennedy Space Center in Cape Canaveral, Fla., Friday, March 1, 2019. The Crew Dragon spacecraft unmanned test flight is scheduled for launch early Saturday morning.

It’s not clear how this affects planned for crewed missions.

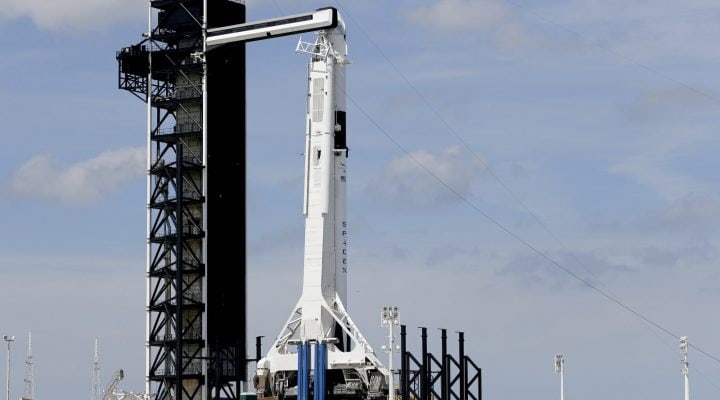
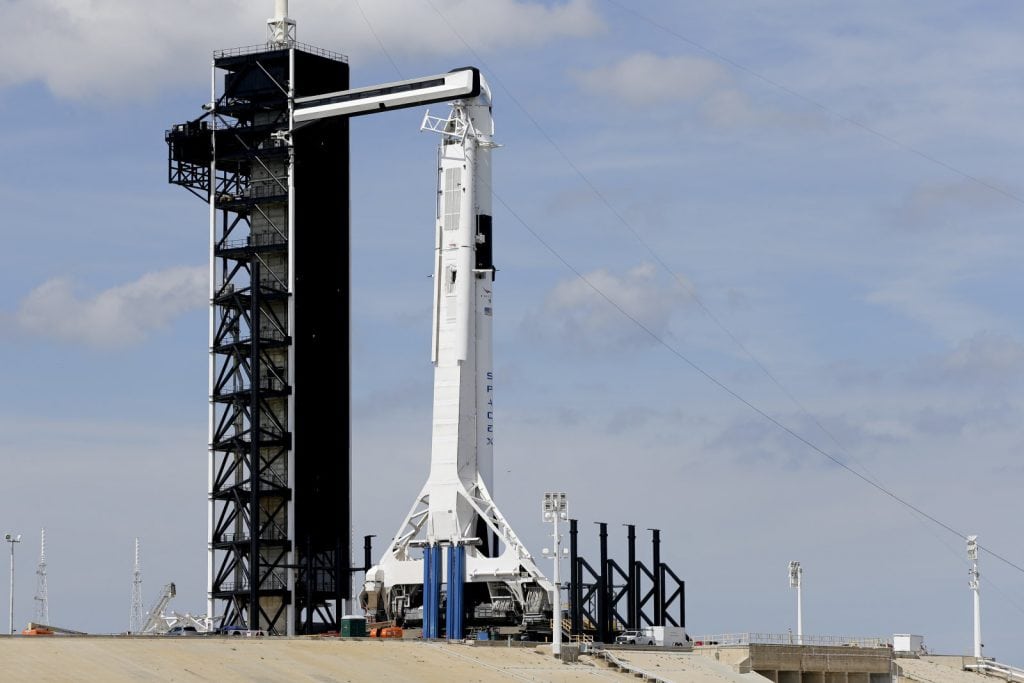
SpaceX’s dreams of crewed spaceflight appear to have faced a setback. The company and the US Air Force’s 45th Space Wing have confirmed to Florida Today that a Crew Dragon capsule suffered an “anomaly” during a static test fire at Cape Canaveral. Most tests went according to plan, SpaceX said, but a “final test” led to problems on the testing stand. Observers could see smoke from miles away, suggesting that the capsule or something attached to it had caught fire.

The company had been gearing up for a mission abort test that would have fired all eight of Crew Dragon’s SuperDraco engines in mid-launch, showing that the capsule could get away from its host rocket in an emergency. That test was supposed to take place in June, but it’s not certain this will happen on schedule in light of the incident. A crewed launch was supposed to take place as soon as July, but it seems likely the timeline will change for that as well.

NASA isn’t deterred by the mishap. Administrator Jim Bridenstine said in a statement that anomalies like this are “why we test,” and that the space agency would “learn, make the necessary adjustments” and push forward with its Commercial Crew Program. Still, this clearly isn’t what NASA wanted to hear months before it was poised to make history — it’s another reminder that the road to private human spaceflight has been perilous.

Particle learning system could help robots make sushi

Robotic hands could grab with a gentler, subtler touch.

There have been many attempts at teaching robots how to grab delicate objects, but they tend to rely on rough approximations that quickly fall apart in real life. MIT researchers may have a better solution: teach robots to predict how even the squishiest items will react to their touch. They’ve developed a “learning-based” particle simulation system that helps robots refine their approach. The new model captures how small pieces of a given material (the “particles” in question) react to touch, and learns from that information when the physics of a given interaction aren’t clear. It’s akin to how humans intuitively understand grip — we already have ideas based on our personal understanding of physics.

The team demonstrated its system by tasking a two-fingered robot, RiceGrip, with reshaping deformable foam into a desired shape, much like you might shape sushi. It used a depth camera and object recognition to identify the foam, and then used the model to envision the foam as a dynamic graph for deformable materials. While it already had an idea as to how the particles would react, it would adjust its model if the “sushi” behaved in a way it didn’t expect.

It’s still early days, and the scientists want to improve their approach by using partly observable situations (such as knowing how a pile of boxes will fall. They’d also like it to work directly with imagery. If and when that happens, though, it could represent a breakthrough for robots. They’d have an easier time manipulating virtually any kind of object, even when liquids or soft solids might make the results difficult to determine in advance. While robots might not replace sushi chefs any time soon, MIT’s learning method makes the prospect that much more realistic.

Google Lens may add translation and restaurant ‘filters’

You might not need to rely quite so much on other apps.

As clever as Google Lens can be, it’s still quite limited in what it can do before it points you to another app. You might not have to lean on those other apps quite so often n the near future. In the wake of an initial discovery earlier in April, the 9to5Google team has spotted evidence that Lens could soon include a host of “filters” aimed at fulfilling specific augmented reality tasks. A “translate” filter, for instance, might auto-detect one language and offer to convert it to another instead of simply copying text and asking to launch Google Translate.

There are also references to a “dining” filter that would search nearby restaurants, including popular dishes. A “shopping” filter appears to focus on more generic goods. Combined with the translation feature, it appears as if Google wants to offer a range of specialized searches instead of a one-size-fits-all function.

It’s not certain when the upgraded Lens might arrive, assuming it does at all. With I/O starting on May 7th, though, it wouldn’t be surprising if Google revealed or even releaseed the feature as its developer conference got underway.

SiriusXM’s Essential streaming service doesn’t need car satellite radios

It costs $8 a month after a three-month testing period that’ll set you back $1.

SiriusXM is hoping to carve a place for itself on your phones and smart speakers. The company mostly associated with in-vehicle entertainment has launched a purely online streaming service called SiriusXM Essential. It’ll set you back $8 a month — with a three-month testing period that costs $1 — and doesn’t need a compatible car satellite radio to work.

An Essential subscription also gives you access to over 200 channels, including all the network’s musical programming, along with comedy, news and sports shows. However, the plan doesn’t come with Howard Stern’s, the NBA, NHL and NCAA channels. According to Variety, you’ll have to wait for the $13 Premier Streaming plan to come out in mid-May if you want access to those, as well.

Matt Epstein, the company’s VP of marketing, told the publication that SiriusXM introduced Essential to attract younger audiences. Particularly those who might not own cars, those who don’t drive nearly often or long enough to justify a full subscription and those who haven’t gotten the chance to try SiriusXM before. “They don’t spend a long time driving to make it worthwhile,” he said, adding that “a lot of people just don’t know about [SiriusXM].”

In addition, the broadcasting company wants to lure more subscribers who want a cheaper option for in-home listening. Epstein said that the company has “seen a massive increase in in-home listening” over the past year, most likely after SiriusXM gave Echo owners three months of free access.

Stocks to Watch: NVR, Inc. (NYSE:NVR), Levi Strauss & Co. (NYSE:LEVI) Valuation in Focus

The ERP5 Rank is an investment tool that analysts use to discover undervalued companies.  The ERP5 looks at the Price to Book ratio, Earnings Yield, ROIC and 5 year average ROIC.  The ERP5 of NVR, Inc. (NYSE:NVR) is 3402.  The lower the ERP5 rank, the more undervalued a company is thought to be.

Many individual investors who trade stocks are looking for the next big breakout. It can be much more exciting to be able to tell glamorous stories of picking a winning stock before everybody else was aware. Of course, this is no easy task. There are so many stocks to choose from, and hunting for undervalued stocks may take lots of time that many investors do not have. Other investors will strictly trade the big established names with the hope that consistent growth will provide stable returns to the portfolio. Understanding risks involved with picking stocks can help the investor figure out what is best for them individually. It is typically considered wise to make sure that there is proper diversification in the stock portfolio. Finding that balance to achieve long lasting portfolio health is generally what most investors attempt to accomplish when trading equities.

FCF Yield 5yr Avg 

The FCF Yield 5yr Average is calculated by taking the five year average free cash flow of a company, and dividing it by the current enterprise value. Enterprise Value is calculated by taking the market capitalization plus debt, minority interest and preferred shares, minus total cash and cash equivalents. The average FCF of a company is determined by looking at the cash generated by operations of the company. The Free Cash Flow Yield 5 Year Average of NVR, Inc. (NYSE:NVR) is 0.027703.

Technicals & Ratios

The EBITDA Yield is a great way to determine a company’s profitability. This number is calculated by dividing a company’s earnings before interest, taxes, depreciation and amortization by the company’s enterprise value. Enterprise Value is calculated by taking the market capitalization plus debt, minority interest and preferred shares, minus total cash and cash equivalents. The EBITDA Yield for NVR, Inc. (NYSE:NVR) is 0.091149.

The Earnings to Price yield of NVR, Inc. (NYSE:NVR) is 0.071262.  This is calculated by taking the earnings per share and dividing it by the last closing share price.  This is one of the most popular methods investors use to evaluate a company’s financial performance.  Earnings Yield is calculated by taking the operating income or earnings before interest and taxes (EBIT) and dividing it by the Enterprise Value of the company.  The Earnings Yield for NVR, Inc. (NYSE:NVR) is 0.089332.  

Earnings Yield helps investors measure the return on investment for a given company.  Similarly, the Earnings Yield Five Year Average is the five year average operating income or EBIT divided by the current enterprise value.  The Earnings Yield Five Year average for NVR, Inc. is 0.056078.

Q.i. Value

The Q.i. Value of NVR, Inc. (NYSE:NVR) is 22.00000. The Q.i. Value is another helpful tool in determining if a company is undervalued or not. The Q.i. Value is calculated using the following ratios: EBITDA Yield, Earnings Yield, FCF Yield, and Liquidity. The lower the Q.i. value, the more undervalued the company is thought to be.

Quant Scores

The M-Score, conceived by accounting professor Messod Beneish, is a model for detecting whether a company has manipulated their earnings numbers or not. NVR, Inc. (NYSE:NVR) has an M-Score of -2.385358. The M-Score is based on 8 different variables: Days’ sales in receivables index, Gross Margin Index, Asset Quality Index, Sales Growth Index, Depreciation Index, Sales, General and Administrative expenses Index, Leverage Index and Total Accruals to Total Assets. A score higher than -1.78 is an indicator that the company might be manipulating their numbers.

The Value Composite One (VC1) is a method that investors use to determine a company’s value. The VC1 of NVR, Inc. (NYSE:NVR) is 42. A company with a value of 0 is thought to be an undervalued company, while a company with a value of 100 is considered an overvalued company. The VC1 is calculated using the price to book value, price to sales, EBITDA to EV, price to cash flow, and price to earnings. Similarly, the Value Composite Two (VC2) is calculated with the same ratios, but adds the Shareholder Yield. The Value Composite Two of NVR, Inc. (NYSE:NVR) is 35.

Investors may be interested in viewing the Gross Margin score on shares of NVR, Inc. (NYSE:NVR). The name currently has a score of 8.00000. This score is derived from the Gross Margin (Marx) stability and growth over the previous eight years. The Gross Margin score lands on a scale from 1 to 100 where a score of 1 would be considered positive, and a score of 100 would be seen as negative.

At the time of writing, NVR, Inc. (NYSE:NVR) has a Piotroski F-Score of 7. The F-Score may help discover companies with strengthening balance sheets. The score may also be used to spot the weak performers. Joseph Piotroski developed the F-Score which employs nine different variables based on the company financial statement. A single point is assigned to each test that a stock passes. Typically, a stock scoring an 8 or 9 would be seen as strong. On the other end, a stock with a score from 0-2 would be viewed as weak.

From time to time, even solid companies may experience some sort of setback. Just because a company encounters one negative event, it might not be appropriate to sell the stock. Often times, the stock may still be valuable on a fundamental level, and there may be plenty of room for resurgence. When bad news hits, the stock price may be greatly impacted. Sometimes there can be an overexaggeration which leads to erroneous selling. This can in turn provide buying opportunities to those in the know. Investors who do the homework and closely examine the underlying numbers may put themselves in a good position when situation like this arise. Investors that are looking for longer term value may find that a panic sell-off is the perfect chance to get into a stock that has just suffered a temporary setback. Paying attention to these occurrences can greatly help the investor spot potential buying opportunities in the equity market.

Levi Strauss & Co. (NYSE:LEVI) has an ERP5 rank of 7184. The ERP5 Rank is an investment tool that analysts use to discover undervalued companies.  The ERP5 looks at the Price to Book ratio, Earnings Yield, ROIC and 5 year average ROIC.  The lower the ERP5 rank, the more undervalued a company is thought to be.

Individuals may have the tendency to make irrational investing decisions based on certain biases rather than focusing on market fundamentals. They might purchase a certain stock when the price is surging higher or when the entire stock market is in an upswing. This behavior is typically driven by the fear of missing out on possible profits that they think that everybody else is making. When the market continues to rise, they may believe that they need to get in quick before missing out completely. On the other side, investors may be too quick to sell a certain stock when it is been moving to the downside. They may be scared of further losses and the fear of uncertainty may creep in and cause unnecessary selling. 

Q.i. Value

The Q.i. Value of Levi Strauss & Co. (NYSE:LEVI) is 41.00000. The Q.i. Value is another helpful tool in determining if a company is undervalued or not. The Q.i. Value is calculated using the following ratios: EBITDA Yield, Earnings Yield, FCF Yield, and Liquidity. The lower the Q.i. value, the more undervalued the company is thought to be.

The EBITDA Yield is a great way to determine a company’s profitability. This number is calculated by dividing a company’s earnings before interest, taxes, depreciation and amortization by the company’s enterprise value. Enterprise Value is calculated by taking the market capitalization plus debt, minority interest and preferred shares, minus total cash and cash equivalents. The EBITDA Yield for Levi Strauss & Co. (NYSE:LEVI) is 0.065309.

The Earnings to Price yield of Levi Strauss & Co. (NYSE:LEVI) is 0.048057.  This is calculated by taking the earnings per share and dividing it by the last closing share price.  This is one of the most popular methods investors use to evaluate a company’s financial performance.  Earnings Yield is calculated by taking the operating income or earnings before interest and taxes (EBIT) and dividing it by the Enterprise Value of the company.  The Earnings Yield for Levi Strauss & Co. NYSE:LEVI is 0.054104.  Earnings Yield helps investors measure the return on investment for a given company.  Similarly, the Earnings Yield Five Year Average is the five year average operating income or EBIT divided by the current enterprise value.  The Earnings Yield Five Year average for Levi Strauss & Co. is 0.047360.

FCF Yield 5yr Avg

The FCF Yield 5yr Average is calculated by taking the five year average free cash flow of a company, and dividing it by the current enterprise value. Enterprise Value is calculated by taking the market capitalization plus debt, minority interest and preferred shares, minus total cash and cash equivalents. The average FCF of a company is determined by looking at the cash generated by operations of the company. The Free Cash Flow Yield 5 Year Average of Levi Strauss & Co. (NYSE:LEVI) is 0.022130.

Price to book, Price to cash flow, Price to earnings

The Price to book ratio is the current share price of a company divided by the book value per share. The Price to Book ratio for Levi Strauss & Co. NYSE:LEVI is 13.759191. A lower price to book ratio indicates that the stock might be undervalued. Similarly, Price to cash flow ratio is another helpful ratio in determining a company’s value. The Price to Cash Flow for Levi Strauss & Co. (NYSE:LEVI) is 22.773271. This ratio is calculated by dividing the market value of a company by cash from operating activities. Additionally, the price to earnings ratio is another popular way for analysts and investors to determine a company’s profitability. The price to earnings ratio for Levi Strauss & Co. (NYSE:LEVI) is 20.808825. This ratio is found by taking the current share price and dividing by earnings per share.

Value Comp 1 / Value Comp 2

The Value Composite One (VC1) is a method that investors use to determine a company’s value. The VC1 of Levi Strauss & Co. (NYSE:LEVI) is 54. A company with a value of 0 is thought to be an undervalued company, while a company with a value of 100 is considered an overvalued company. The VC1 is calculated using the price to book value, price to sales, EBITDA to EV, price to cash flow, and price to earnings. Similarly, the Value Composite Two (VC2) is calculated with the same ratios, but adds the Shareholder Yield. The Value Composite Two of Levi Strauss & Co. (NYSE:LEVI) is 52.

Volatility 12 m, 6m, 3m

Stock volatility is a percentage that indicates whether a stock is a desirable purchase. Investors look at the Volatility 12m to determine if a company has a low volatility percentage or not over the course of a year. The Volatility 12m of Levi Strauss & Co. (NYSE:LEVI) is 0.000000. This is calculated by taking weekly log normal returns and standard deviation of the share price over one year annualized. The lower the number, a company is thought to have low volatility. The Volatility 3m is a similar percentage determined by the daily log normal returns and standard deviation of the share price over 3 months. The Volatility 3m of Levi Strauss & Co. (NYSE:LEVI) is 0.000000. The Volatility 6m is the same, except measured over the course of six months. The Volatility 6m is 0.000000.

MF Rank

The MF Rank (aka the Magic Formula) is a formula that pinpoints a valuable company trading at a good price. The formula is calculated by looking at companies that have a high earnings yield as well as a high return on invested capital. The MF Rank of Levi Strauss & Co. (NYSE:LEVI) is 4698. A company with a low rank is considered a good company to invest in. The Magic Formula was introduced in a book written by Joel Greenblatt, entitled, “The Little Book that Beats the Market”.

Piotroski F-Score

The Piotroski F-Score is a scoring system between 1-9 that determines a firm’s financial strength. The score helps determine if a company’s stock is valuable or not. The Piotroski F-Score of Levi Strauss & Co. (NYSE:LEVI) is 7. A score of nine indicates a high value stock, while a score of one indicates a low value stock. The score is calculated by the return on assets (ROA), Cash flow return on assets (CFROA), change in return of assets, and quality of earnings. It is also calculated by a change in gearing or leverage, liquidity, and change in shares in issue. The score is also determined by change in gross margin and change in asset turnover.

Return on Assets

There are many different tools to determine whether a company is profitable or not. One of the most popular ratios is the “Return on Assets” (aka ROA). This score indicates how profitable a company is relative to its total assets. The Return on Assets for Levi Strauss & Co. (NYSE:LEVI) is 0.139431. This number is calculated by dividing net income after tax by the company’s total assets. A company that manages their assets well will have a higher return, while a company that manages their assets poorly will have a lower return.

Dedicated investors are usually on the lookout for promising stocks that have been overlooked by the investment community. They may be searching for companies that have slipped under the radar and are primed for a move higher. Some investors may do the research and locate these stocks that are infrequently in the financial news headlines and are relatively unknown by the average investor. These stocks may be smaller cap, trading on a foreign exchange, or stocks that used to be prominent that have not been part of the conversation recently. Finding these stocks may take some extra research and effort. Investors who are able to do enough digging may be able to find some great names to help support the stock portfolio.

Stocks to Watch: NextEra Energy Partners, LP (NYSE:NEP), Carbonite, Inc. (NasdaqGM:CARB) Valuation in Focus

NextEra Energy Partners, LP (NYSE:NEP) has an ERP5 rank of 10258. The ERP5 Rank is an investment tool that analysts use to discover undervalued companies.  It looks at the stock’s Price to Book ratio, Earnings Yield, ROIC and 5 year average ROIC.  The lower the rank, the more undervalued a company is considered to be.

Many individual investors who trade stocks are looking for the next big breakout. It can be much more exciting to be able to tell glamorous stories of picking a winning stock before everybody else was aware. Of course, this is no easy task. There are so many stocks to choose from, and hunting for undervalued stocks may take lots of time that many investors do not have. Other investors will strictly trade the big established names with the hope that consistent growth will provide stable returns to the portfolio. Understanding risks involved with picking stocks can help the investor figure out what is best for them individually. It is typically considered wise to make sure that there is proper diversification in the stock portfolio. Finding that balance to achieve long lasting portfolio health is generally what most investors attempt to accomplish when trading equities.

FCF Yield 5yr Avg 

The FCF Yield 5yr Average is calculated by taking the five year average free cash flow of a company, and dividing it by the current enterprise value. Enterprise Value is calculated by taking the market capitalization plus debt, minority interest and preferred shares, minus total cash and cash equivalents. The average FCF of a company is determined by looking at the cash generated by operations of the company. The Free Cash Flow Yield 5 Year Average of NextEra Energy Partners, LP (NYSE:NEP) is -0.027634.

Technicals & Ratios

The EBITDA Yield is a great way to determine a company’s profitability. This number is calculated by dividing a company’s earnings before interest, taxes, depreciation and amortization by the company’s enterprise value. Enterprise Value is calculated by taking the market capitalization plus debt, minority interest and preferred shares, minus total cash and cash equivalents. The EBITDA Yield for NextEra Energy Partners, LP (NYSE:NEP) is 0.051361.

The Earnings to Price yield of NextEra Energy Partners, LP (NYSE:NEP) is 0.063026.  This is calculated by taking the earnings per share and dividing it by the last closing share price.  This is one of the most popular methods investors use to evaluate a company’s financial performance.  Earnings Yield is calculated by taking the operating income or earnings before interest and taxes (EBIT) and dividing it by the Enterprise Value of the company.  The Earnings Yield for NextEra Energy Partners, LP (NYSE:NEP) is 0.029205.  

Earnings Yield helps investors measure the return on investment for a given company.  Similarly, the Earnings Yield Five Year Average is the five year average operating income or EBIT divided by the current enterprise value.  The Earnings Yield Five Year average for NextEra Energy Partners, LP is 0.021410.

Q.i. Value

The Q.i. Value of NextEra Energy Partners, LP (NYSE:NEP) is 41.00000. The Q.i. Value is another helpful tool in determining if a company is undervalued or not. The Q.i. Value is calculated using the following ratios: EBITDA Yield, Earnings Yield, FCF Yield, and Liquidity. The lower the Q.i. value, the more undervalued the company is thought to be.

Quant Scores

The M-Score, conceived by accounting professor Messod Beneish, is a model for detecting whether a company has manipulated their earnings numbers or not. NextEra Energy Partners, LP (NYSE:NEP) has an M-Score of -999.000000. The M-Score is based on 8 different variables: Days’ sales in receivables index, Gross Margin Index, Asset Quality Index, Sales Growth Index, Depreciation Index, Sales, General and Administrative expenses Index, Leverage Index and Total Accruals to Total Assets. A score higher than -1.78 is an indicator that the company might be manipulating their numbers.

The Value Composite One (VC1) is a method that investors use to determine a company’s value. The VC1 of NextEra Energy Partners, LP (NYSE:NEP) is 37. A company with a value of 0 is thought to be an undervalued company, while a company with a value of 100 is considered an overvalued company. The VC1 is calculated using the price to book value, price to sales, EBITDA to EV, price to cash flow, and price to earnings. Similarly, the Value Composite Two (VC2) is calculated with the same ratios, but adds the Shareholder Yield. The Value Composite Two of NextEra Energy Partners, LP (NYSE:NEP) is 36.

Investors may be interested in viewing the Gross Margin score on shares of NextEra Energy Partners, LP (NYSE:NEP). The name currently has a score of 50.00000. This score is derived from the Gross Margin (Marx) stability and growth over the previous eight years. The Gross Margin score lands on a scale from 1 to 100 where a score of 1 would be considered positive, and a score of 100 would be seen as negative.

At the time of writing, NextEra Energy Partners, LP (NYSE:NEP) has a Piotroski F-Score of 5. The F-Score may help discover companies with strengthening balance sheets. The score may also be used to spot the weak performers. Joseph Piotroski developed the F-Score which employs nine different variables based on the company financial statement. A single point is assigned to each test that a stock passes. Typically, a stock scoring an 8 or 9 would be seen as strong. On the other end, a stock with a score from 0-2 would be viewed as weak.

From time to time, even solid companies may experience some sort of setback. Just because a company encounters one negative event, it might not be appropriate to sell the stock. Often times, the stock may still be valuable on a fundamental level, and there may be plenty of room for resurgence. When bad news hits, the stock price may be greatly impacted. Sometimes there can be an overexaggeration which leads to erroneous selling. This can in turn provide buying opportunities to those in the know. Investors who do the homework and closely examine the underlying numbers may put themselves in a good position when situation like this arise. Investors that are looking for longer term value may find that a panic sell-off is the perfect chance to get into a stock that has just suffered a temporary setback. Paying attention to these occurrences can greatly help the investor spot potential buying opportunities in the equity market.

The ERP5 Rank is an investment tool that analysts use to discover undervalued companies.  The ERP5 looks at the Price to Book ratio, Earnings Yield, ROIC and 5 year average ROIC.  The ERP5 of Carbonite, Inc. (NasdaqGM:CARB) is 13580.  The lower the ERP5 rank, the more undervalued a company is thought to be.

Individuals may have the tendency to make irrational investing decisions based on certain biases rather than focusing on market fundamentals. They might purchase a certain stock when the price is surging higher or when the entire stock market is in an upswing. This behavior is typically driven by the fear of missing out on possible profits that they think that everybody else is making. When the market continues to rise, they may believe that they need to get in quick before missing out completely. On the other side, investors may be too quick to sell a certain stock when it is been moving to the downside. They may be scared of further losses and the fear of uncertainty may creep in and cause unnecessary selling. 

Q.i. Value

The Q.i. Value of Carbonite, Inc. (NasdaqGM:CARB) is 51.00000. The Q.i. Value is another helpful tool in determining if a company is undervalued or not. The Q.i. Value is calculated using the following ratios: EBITDA Yield, Earnings Yield, FCF Yield, and Liquidity. The lower the Q.i. value, the more undervalued the company is thought to be.

The EBITDA Yield is a great way to determine a company’s profitability. This number is calculated by dividing a company’s earnings before interest, taxes, depreciation and amortization by the company’s enterprise value. Enterprise Value is calculated by taking the market capitalization plus debt, minority interest and preferred shares, minus total cash and cash equivalents. The EBITDA Yield for Carbonite, Inc. (NasdaqGM:CARB) is 0.031370.

The Earnings to Price yield of Carbonite, Inc. (NasdaqGM:CARB) is 0.009026.  This is calculated by taking the earnings per share and dividing it by the last closing share price.  This is one of the most popular methods investors use to evaluate a company’s financial performance.  Earnings Yield is calculated by taking the operating income or earnings before interest and taxes (EBIT) and dividing it by the Enterprise Value of the company.  The Earnings Yield for Carbonite, Inc. NasdaqGM:CARB is 0.005164.  Earnings Yield helps investors measure the return on investment for a given company.  Similarly, the Earnings Yield Five Year Average is the five year average operating income or EBIT divided by the current enterprise value.  The Earnings Yield Five Year average for Carbonite, Inc. is -0.010142.

FCF Yield 5yr Avg

The FCF Yield 5yr Average is calculated by taking the five year average free cash flow of a company, and dividing it by the current enterprise value. Enterprise Value is calculated by taking the market capitalization plus debt, minority interest and preferred shares, minus total cash and cash equivalents. The average FCF of a company is determined by looking at the cash generated by operations of the company. The Free Cash Flow Yield 5 Year Average of Carbonite, Inc. (NasdaqGM:CARB) is 0.007747.

Price to book, Price to cash flow, Price to earnings

The Price to book ratio is the current share price of a company divided by the book value per share. The Price to Book ratio for Carbonite, Inc. NasdaqGM:CARB is 3.257373. A lower price to book ratio indicates that the stock might be undervalued. Similarly, Price to cash flow ratio is another helpful ratio in determining a company’s value. The Price to Cash Flow for Carbonite, Inc. (NasdaqGM:CARB) is 15.634053. This ratio is calculated by dividing the market value of a company by cash from operating activities. Additionally, the price to earnings ratio is another popular way for analysts and investors to determine a company’s profitability. The price to earnings ratio for Carbonite, Inc. (NasdaqGM:CARB) is 110.794620. This ratio is found by taking the current share price and dividing by earnings per share.

Value Comp 1 / Value Comp 2

The Value Composite One (VC1) is a method that investors use to determine a company’s value. The VC1 of Carbonite, Inc. (NasdaqGM:CARB) is 59. A company with a value of 0 is thought to be an undervalued company, while a company with a value of 100 is considered an overvalued company. The VC1 is calculated using the price to book value, price to sales, EBITDA to EV, price to cash flow, and price to earnings. Similarly, the Value Composite Two (VC2) is calculated with the same ratios, but adds the Shareholder Yield. The Value Composite Two of Carbonite, Inc. (NasdaqGM:CARB) is 68.

Volatility 12 m, 6m, 3m

Stock volatility is a percentage that indicates whether a stock is a desirable purchase. Investors look at the Volatility 12m to determine if a company has a low volatility percentage or not over the course of a year. The Volatility 12m of Carbonite, Inc. (NasdaqGM:CARB) is 43.239200. This is calculated by taking weekly log normal returns and standard deviation of the share price over one year annualized. The lower the number, a company is thought to have low volatility. The Volatility 3m is a similar percentage determined by the daily log normal returns and standard deviation of the share price over 3 months. The Volatility 3m of Carbonite, Inc. (NasdaqGM:CARB) is 52.489100. The Volatility 6m is the same, except measured over the course of six months. The Volatility 6m is 64.018700.

MF Rank

The MF Rank (aka the Magic Formula) is a formula that pinpoints a valuable company trading at a good price. The formula is calculated by looking at companies that have a high earnings yield as well as a high return on invested capital. The MF Rank of Carbonite, Inc. (NasdaqGM:CARB) is 10794. A company with a low rank is considered a good company to invest in. The Magic Formula was introduced in a book written by Joel Greenblatt, entitled, “The Little Book that Beats the Market”.

Piotroski F-Score

The Piotroski F-Score is a scoring system between 1-9 that determines a firm’s financial strength. The score helps determine if a company’s stock is valuable or not. The Piotroski F-Score of Carbonite, Inc. (NasdaqGM:CARB) is 7. A score of nine indicates a high value stock, while a score of one indicates a low value stock. The score is calculated by the return on assets (ROA), Cash flow return on assets (CFROA), change in return of assets, and quality of earnings. It is also calculated by a change in gearing or leverage, liquidity, and change in shares in issue. The score is also determined by change in gross margin and change in asset turnover.

Return on Assets

There are many different tools to determine whether a company is profitable or not. One of the most popular ratios is the “Return on Assets” (aka ROA). This score indicates how profitable a company is relative to its total assets. The Return on Assets for Carbonite, Inc. (NasdaqGM:CARB) is 0.024174. This number is calculated by dividing net income after tax by the company’s total assets. A company that manages their assets well will have a higher return, while a company that manages their assets poorly will have a lower return.

Dedicated investors are usually on the lookout for promising stocks that have been overlooked by the investment community. They may be searching for companies that have slipped under the radar and are primed for a move higher. Some investors may do the research and locate these stocks that are infrequently in the financial news headlines and are relatively unknown by the average investor. These stocks may be smaller cap, trading on a foreign exchange, or stocks that used to be prominent that have not been part of the conversation recently. Finding these stocks may take some extra research and effort. Investors who are able to do enough digging may be able to find some great names to help support the stock portfolio.