Archives for April 10, 2019

Google has more Pixel tablets, laptops on the way

The story doesn’t end with the Pixelbook and Pixel Slate.

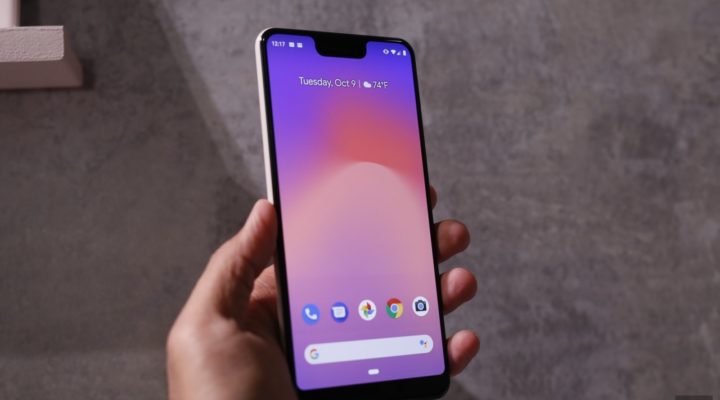
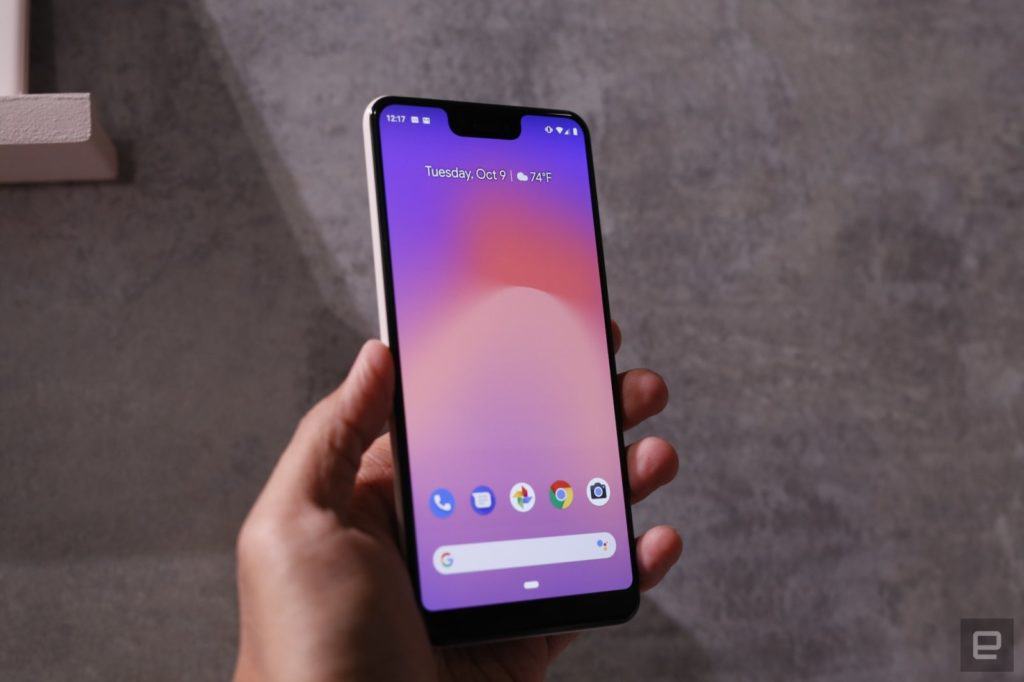
If you’re waiting for a follow-up to Google’s Pixelbook laptop or Pixel Slate convertible tablet, then there’s good news. Following a report last month by Business Insider that Google had trimmed its “Create” division by sending employees to other parts of the company and would likely “pare down” its hardware offerings, The Verge has a statement from the company tonight confirming new tablets and laptops are on the way.

Not coincidentally, 9to5Google reported on a session earlier today from Google’s Cloud Next 2019 event where it discussed the potential of future hardware. Talking about employees who work outside the office, 9to5Google quoted Pixelbook product manager Steve Jacobs saying “And we think there’s some unique things we can do differently than the Pixelbook and Pixel Slate that are going to really help give them what they’re looking for when they’re working in this new modern cloud-first era.”

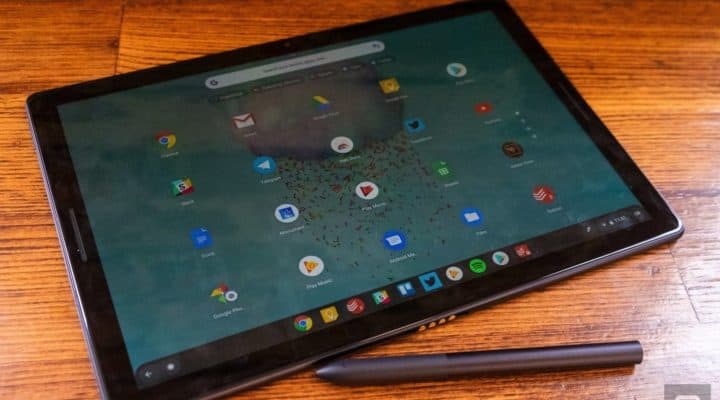
In our review the Pixel Slate presented a software experience that qualified as both confusing and frustrating, but as Google’s Trond Wuellner explained at CES, products like that can inspire innovation. Meanwhile the Pixelbook is in need of a hardware refresh to keep up with similarly-priced competition, even if it’s perfectly-qualified as a cloud-first premium laptop. As Google keeps building up its cloud services — including gaming with Stadia — it will be interesting to see what its engineers have to show off over the next few months.

Pixel and OnePlus buyers typically switch from Samsung phones

Only a relatively small fraction of them are iPhone converts.

Who do you think is most likely to switch to value-for-money phones like the Pixel 3 and OnePlus 6T? Former iPhone users balking at iOS or top-tier pricing? No — it’s prior Samsung owners, according to a study. Counterpoint Research estimated that ex-Galaxy users represented 51 percent of Pixel 3 buyers and 37 percent of 6T customers in the fourth quarter of 2018. While there were iPhone converts, they were much smaller slices of the pie at 18 percent for the Pixel and 16 percent for the 6T.

Not surprisingly, many of those Samsung users (31 percent of all Pixel 3 buyers) were coming from the Galaxy S7, a device roughly two years old. Counterpoint also found that 14 percent of Pixel 3 buyers were coming from Motorola handsets, while 15 percent of OnePlus’ shoppers previously used LG devices.

These aren’t completely shocking figures. Both handsets are potentially better value for money than Samsung’s phones, and in some ways are considered polar opposites — they aren’t saddled with as much software bloat, and typically enjoy timelier OS updates. Still, Counterpoint believes this could be a “disappointment,” particularly to Google. The company has long positioned the Pixel line as an iPhone alternative, but 82 percent of its customers are already using Android. It’s not so much expanding Android’s reach as it is poaching sales from its own partners.

Two stocks To Watch For Long-Term Investors: L Brands, Inc. (LB), Nutanix, Inc. (NTNX)

L Brands, Inc. (NYSE: LB) experienced a high price of with a low value of $27.35 at the end of the last trading session, which followed after a gain of 0.07% and settled at $27.48 during the course of the last 24 hours for the day. Respectfully, the company now has 277.80M shares after the latest changes, so the present market capitalization sits at $7.63B. The trading volume of L Brands, Inc. shares went over 3,022,557 in a single day during the last trading session in comparison to the average volume of LB, usually circulating around 4.44M.

During the course of the last year, the stock has touched a high of $38.88 and a low of $23.71, which as a result has the increased attention of top market experts who are tracking the progress of the asset as it is getting closer to a notable historic high price or low value.

Looking at the latest analyst forecasts, the current earnings-per-share (EPS) consensus estimate is sitting at $2.55 per share. In the preceding year, the company reportedly generated EPS of $2.30 per share of its common stock. The profitability indicators are showing that this organization has an operating margin of 9.30%, a profit margin of 4.90%, and a gross margin of 37.00%.

If we were to do a comparison between the current price and its previous movement in the market, we can easily conclude that the price went to a positive change, going up by +0.27 in the past five trading days, which resulted in a percentage change of +0.99% and a moving average of 27.33. In the past 20 days, its price changed by +1.24, which means that the stock’s moving average was 27.35. Looking back at a cycle of the last 50 days, shares of LB changed by -$0.17 (which is -0.61%) and demonstrated a moving average of 27.20. Meanwhile, this stock’s MACD Oscillator was 0.01 over the past 9 days, and 0.03 over the past two weeks, also marking 0.20 in the period of the last 20 days.

Nutanix, Inc. (NASDAQ:NTNX)’s shares demonstrated a change of 2.04% during the most recent trading session, ending the trading day at the price of $37.93 with a 24-hour trading volume that reached 2,848,103 – compared to its average trading volume of as 4.13M, as recorded over the past three months. With that closing price, the market capitalization of this company is now sitting at $6.85B. The moving average for last 20 days of Nutanix, Inc. is at -1.39%, while the average went down by -14.89% during the last 50 days with -18.74% recorded during the last 200 days. Additionally, this stock’s distance from its 52-week high price is currently down by -41.53%, while it’s sitting 16.64% away from its 52-week low price.

When you are considering investing in stocks, it is wise to consider counting in Wall Street analysts’ target prices, which should help you place a more profitable investment. The price targets can provide you with an idea of the predicted movement of stocks you are interested in. At the moment, the price target set for Nutanix, Inc. is $48.56. It’s also helpful to look at the average analyst recommendation score – which is provided on a scale of 1 to 5 where 1 is “strong buy”, 2 is “buy”, 3 is “hold”, 4 is “sell” and 5 is a “strong sell”. Right now, the average analyst recommendation for NTNX stands at 2.10, which indicates that analysts recommend investors to Buy their shares of NTNX until the stock approaches its target price.

Traders use the ATR to analyze potential exit and entry points, as it represents a useful tool in almost any trading strategy. ATR for this stock is sitting at 2.03. Beta tells us about a stock’s volatility, also known as its systematic risk, compared to the market overall. The current beta value for NTNX is , while for the past seven days, this stock’s volatility was 3.52%, also recording 4.56% for the past 30-day period.

Professionals on Wall Street also frequently check the Relative Strength Index (RSI) of a potential investment, which tells us the speed and change of a stock’s price movement in the market. RSI is expressed on a scale of 0 to 100. If the indicators are set higher above 70, then the RSI factors are indicating that the stocks are overbought. The factors will indicate that a stock is oversold if the result is set below 30. Right now, Nutanix, Inc. (NTNX) has an RSI of 42.64 – indicating that the asset is being neither overbought nor oversold.

2 Stocks to Watch Today: Vonage Holdings Corp. (VG), Xcel Energy Inc. (XEL)

Vonage Holdings Corp. (NYSE: VG) experienced a high price of with a low value of $9.52 at the end of the last trading session, which followed after a loss of -0.71% and settled at $9.75 during the course of the last 24 hours for the day. Respectfully, the company now has 238.89M shares after the latest changes, so the present market capitalization sits at $2.33B. The trading volume of Vonage Holdings Corp. shares went over 2,383,271 in a single day during the last trading session in comparison to the average volume of VG, usually circulating around 2.93M.

During the course of the last year, the stock has touched a high of $14.73 and a low of $7.91, which as a result has the increased attention of top market experts who are tracking the progress of the asset as it is getting closer to a notable historic high price or low value.

Looking at the latest analyst forecasts, the current earnings-per-share (EPS) consensus estimate is sitting at $0.25 per share. In the preceding year, the company reportedly generated EPS of $0.14 per share of its common stock. The profitability indicators are showing that this organization has an operating margin of 5.00%, a profit margin of 3.40%, and a gross margin of 59.30%.

If we were to do a comparison between the current price and its previous movement in the market, we can easily conclude that the price went to a negative change, going down by -0.31 in the past five trading days, which resulted in a percentage change of -3.08% and a moving average of 9.83. In the past 20 days, its price changed by -0.43, which means that the stock’s moving average was 9.92. Looking back at a cycle of the last 50 days, shares of VG changed by $+0.59 (which is +6.44%) and demonstrated a moving average of 9.80. Meanwhile, this stock’s MACD Oscillator was -0.10 over the past 9 days, and -0.05 over the past two weeks, also marking -0.14 in the period of the last 20 days.

Xcel Energy Inc. (NASDAQ:XEL)’s shares demonstrated a change of -0.72% during the most recent trading session, ending the trading day at the price of $55.31 with a 24-hour trading volume that reached 2,349,120 – compared to its average trading volume of as 3.46M, as recorded over the past three months. With that closing price, the market capitalization of this company is now sitting at $28.43B. The moving average for last 20 days of Xcel Energy Inc. is at -1.60%, while the average went up by 1.31% during the last 50 days with 10.45% recorded during the last 200 days. Additionally, this stock’s distance from its 52-week high price is currently down by -3.83%, while it’s sitting 31.72% away from its 52-week low price.

When you are considering investing in stocks, it is wise to consider counting in Wall Street analysts’ target prices, which should help you place a more profitable investment. The price targets can provide you with an idea of the predicted movement of stocks you are interested in. At the moment, the price target set for Xcel Energy Inc. is $55.17. It’s also helpful to look at the average analyst recommendation score – which is provided on a scale of 1 to 5 where 1 is “strong buy”, 2 is “buy”, 3 is “hold”, 4 is “sell” and 5 is a “strong sell”. Right now, the average analyst recommendation for XEL stands at 2.60, which indicates that analysts recommend investors to Buy their shares of XEL until the stock approaches its target price.

Traders use the ATR to analyze potential exit and entry points, as it represents a useful tool in almost any trading strategy. ATR for this stock is sitting at 0.72. Beta tells us about a stock’s volatility, also known as its systematic risk, compared to the market overall. The current beta value for XEL is 0.21, while for the past seven days, this stock’s volatility was 1.23%, also recording 1.29% for the past 30-day period.

Professionals on Wall Street also frequently check the Relative Strength Index (RSI) of a potential investment, which tells us the speed and change of a stock’s price movement in the market. RSI is expressed on a scale of 0 to 100. If the indicators are set higher above 70, then the RSI factors are indicating that the stocks are overbought. The factors will indicate that a stock is oversold if the result is set below 30. Right now, Xcel Energy Inc. (XEL) has an RSI of 46.66 – indicating that the asset is being neither overbought nor oversold.

2 Stocks to Watch Today: Fiserv, Inc. (FISV), American Homes 4 Rent (AMH)

Fiserv, Inc. (NASDAQ: FISV) experienced a high price of with a low value of $87.98 at the end of the last trading session, which followed after a loss of -1.70% and settled at $88.33 during the course of the last 24 hours for the day. Respectfully, the company now has 392.93M shares after the latest changes, so the present market capitalization sits at $34.71B. The trading volume of Fiserv, Inc. shares went over 7,079,466 in a single day during the last trading session in comparison to the average volume of FISV, usually circulating around 5.39M.

During the course of the last year, the stock has touched a high of $91.19 and a low of $68.43, which as a result has the increased attention of top market experts who are tracking the progress of the asset as it is getting closer to a notable historic high price or low value.

Looking at the latest analyst forecasts, the current earnings-per-share (EPS) consensus estimate is sitting at $3.91 per share. In the preceding year, the company reportedly generated EPS of $2.91 per share of its common stock. The profitability indicators are showing that this organization has an operating margin of 29.90%, a profit margin of 20.40%, and a gross margin of 47.30%.

If we were to do a comparison between the current price and its previous movement in the market, we can easily conclude that the price went to a negative change, going down by -0.98 in the past five trading days, which resulted in a percentage change of -1.10% and a moving average of 89.74. In the past 20 days, its price changed by +2.30, which means that the stock’s moving average was 87.14. Looking back at a cycle of the last 50 days, shares of FISV changed by $+3.26 (which is +3.83%) and demonstrated a moving average of 85.74. Meanwhile, this stock’s MACD Oscillator was 0.34 over the past 9 days, and 1.62 over the past two weeks, also marking 2.28 in the period of the last 20 days.

American Homes 4 Rent (NYSE:AMH)’s shares demonstrated a change of -0.52% during the most recent trading session, ending the trading day at the price of $22.94 with a 24-hour trading volume that reached 5,275,967 – compared to its average trading volume of as 2.03M, as recorded over the past three months. With that closing price, the market capitalization of this company is now sitting at $6.78B. The moving average for last 20 days of American Homes 4 Rent is at 1.07%, while the average went up by 2.24% during the last 50 days with 5.77% recorded during the last 200 days. Additionally, this stock’s distance from its 52-week high price is currently down by -1.71%, while it’s sitting 21.31% away from its 52-week low price.

When you are considering investing in stocks, it is wise to consider counting in Wall Street analysts’ target prices, which should help you place a more profitable investment. The price targets can provide you with an idea of the predicted movement of stocks you are interested in. At the moment, the price target set for American Homes 4 Rent is $24.17. It’s also helpful to look at the average analyst recommendation score – which is provided on a scale of 1 to 5 where 1 is “strong buy”, 2 is “buy”, 3 is “hold”, 4 is “sell” and 5 is a “strong sell”. Right now, the average analyst recommendation for AMH stands at 1.90 , which indicates that analysts recommend investors to Strong Buy their shares of AMH until the stock approaches its target price.

Traders use the ATR to analyze potential exit and entry points, as it represents a useful tool in almost any trading strategy. ATR for this stock is sitting at 0.30. Beta tells us about a stock’s volatility, also known as its systematic risk, compared to the market overall. The current beta value for AMH is 0.74, while for the past seven days, this stock’s volatility was 1.08%, also recording 1.35% for the past 30-day period.

Professionals on Wall Street also frequently check the Relative Strength Index (RSI) of a potential investment, which tells us the speed and change of a stock’s price movement in the market. RSI is expressed on a scale of 0 to 100. If the indicators are set higher above 70, then the RSI factors are indicating that the stocks are overbought. The factors will indicate that a stock is oversold if the result is set below 30. Right now, American Homes 4 Rent (AMH) has an RSI of 56.07 – indicating that the asset is being neither overbought nor oversold.

Two stocks To Watch For Long-Term Investors: People’s United Financial, Inc. (PBCT), Worldpay, Inc. (WP)

People’s United Financial, Inc. (NASDAQ: PBCT) experienced a high price of with a low value of $16.83 at the end of the last trading session, which followed after a loss of -0.18% and settled at $16.89 during the course of the last 24 hours for the day. Respectfully, the company now has 376.56M shares after the latest changes, so the present market capitalization sits at $6.36B. The trading volume of People’s United Financial, Inc. shares went over 3,275,673 in a single day during the last trading session in comparison to the average volume of PBCT, usually circulating around 3.91M.

During the course of the last year, the stock has touched a high of $19.37 and a low of $13.66, which as a result has the increased attention of top market experts who are tracking the progress of the asset as it is getting closer to a notable historic high price or low value.

Looking at the latest analyst forecasts, the current earnings-per-share (EPS) consensus estimate is sitting at $1.51 per share. In the preceding year, the company reportedly generated EPS of $1.26 per share of its common stock. The profitability indicators are showing that this organization has an operating margin of 77.50%, a profit margin of 29.20%.

If we were to do a comparison between the current price and its previous movement in the market, we can easily conclude that the price went to a positive change, going up by +0.17 in the past five trading days, which resulted in a percentage change of +1.02% and a moving average of 16.81. In the past 20 days, its price changed by -0.49, which means that the stock’s moving average was 16.78. Looking back at a cycle of the last 50 days, shares of PBCT changed by $+0.14 (which is +0.84%) and demonstrated a moving average of 17.04. Meanwhile, this stock’s MACD Oscillator was 0.20 over the past 9 days, and 0.35 over the past two weeks, also marking 0.10 in the period of the last 20 days.

Worldpay, Inc. (NYSE:WP)’s shares demonstrated a change of 0.28% during the most recent trading session, ending the trading day at the price of $114.13 with a 24-hour trading volume that reached 3,155,871 – compared to its average trading volume of as 3.53M, as recorded over the past three months. With that closing price, the market capitalization of this company is now sitting at $35.82B. The moving average for last 20 days of Worldpay, Inc. is at 5.60%, while the average went up by 18.03% during the last 50 days with 26.80% recorded during the last 200 days. Additionally, this stock’s distance from its 52-week high price is currently down by -1.34%, while it’s sitting 62.09% away from its 52-week low price.

When you are considering investing in stocks, it is wise to consider counting in Wall Street analysts’ target prices, which should help you place a more profitable investment. The price targets can provide you with an idea of the predicted movement of stocks you are interested in. At the moment, the price target set for Worldpay, Inc. is $113.00. It’s also helpful to look at the average analyst recommendation score – which is provided on a scale of 1 to 5 where 1 is “strong buy”, 2 is “buy”, 3 is “hold”, 4 is “sell” and 5 is a “strong sell”. Right now, the average analyst recommendation for WP stands at 2.20, which indicates that analysts recommend investors to Buy their shares of WP until the stock approaches its target price.

Traders use the ATR to analyze potential exit and entry points, as it represents a useful tool in almost any trading strategy. ATR for this stock is sitting at 2.23. Beta tells us about a stock’s volatility, also known as its systematic risk, compared to the market overall. The current beta value for WP is 0.91, while for the past seven days, this stock’s volatility was 1.31%, also recording 2.05% for the past 30-day period.

Professionals on Wall Street also frequently check the Relative Strength Index (RSI) of a potential investment, which tells us the speed and change of a stock’s price movement in the market. RSI is expressed on a scale of 0 to 100. If the indicators are set higher above 70, then the RSI factors are indicating that the stocks are overbought. The factors will indicate that a stock is oversold if the result is set below 30. Right now, Worldpay, Inc. (WP) has an RSI of 74.93 – indicating that the asset is being overbought.