Archives for January 11, 2019

Eargo Neo is a hearing aid you might actually want to wear

Eargo Neo is a hearing aid you might actually want to wear

Six years ago I faced a choice: Risk facial paralysis, or potentially lose some hearing in my left ear. I opted for the latter, and two surgeries later, my ability to hear high and mid frequencies on one side is notably diminished. I’ve tried several hearing aids since then, and while some have worked well, for a combination of reasons (my hearing’s tolerable without, the batteries run out too fast, comfort and the stigma / general appearance) I rarely stick with them. Enter the Eargo Neo, a hearing aid that, judging by my list of reasons not to wear something, was pretty much made for people like me.

Eargo has been around since at least 2015, with a couple of products under its belt. The company’s website states that it believes people should wear a hearing aid because they want to, not because they have to (and as I don’t have to, I have tended to avoid it). This week at CES, the company announced its latest model — the Neo — and I’m wearing it right now. I’ve been wearing it for a couple of days in fact. Importantly, I might even go as far to say I find myself “wanting” to wear it.

The Neo, along with the rest of Eargo’s hearing aids, are small, and of the “ITE” (in the ear) or “invisible” variety. This one thing alone, while far from unique, is a major selling point — that said, I’ve never seen hearing aids this small. I’ve tried several BTE (behind the ear) solutions, even fairly discreet ones, but they all suffer from at least two problems for me: They don’t feel secure or just look and feel plain ugly (adding to that stigma). As someone who wears glasses, there’s also an extra minor annoyance — the two things vying for space on my ear.

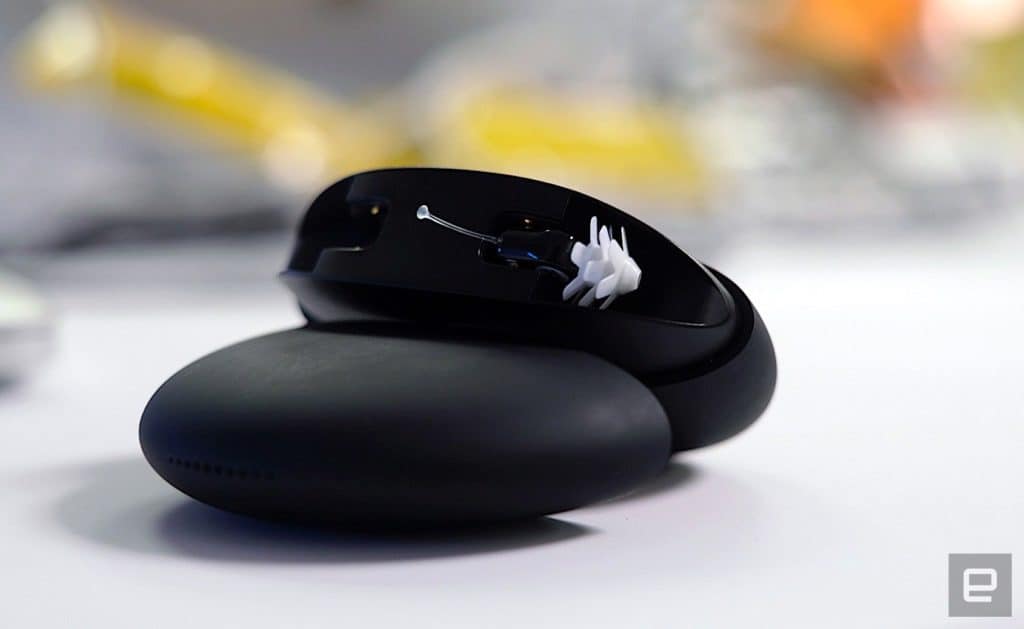
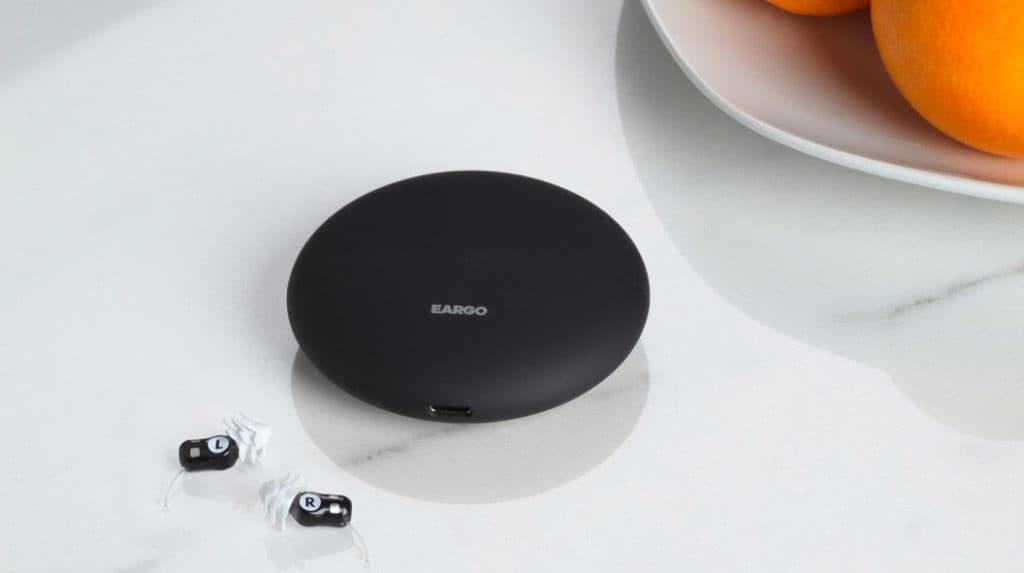
Perhaps the biggest difference with the Eargo line in general,is how the whole packaging looks and the experience feels. The Neo comes in a smooth, circular charging case that looks more “AirPods” than a medical device. The case will charge your Neos every time you pop them back in — like when you go to bed. According to the company, you can keep your Neos charged for a week this way (you charge the case whenever in-between). That same case contains Bluetooth, so when the buds are in there, you can alter settings via the mobile app. This means you can’t do that while wearing them, but it also means the Bluetooth tech is in the case, and not the buds, allowing them to be smaller and have better battery life.

Other modern touches include gestures to change presets (tap the side of your head twice) and an app that lets you create custom audio profiles, send feedback and contact one of Eargo’s audio professionals. Nearer to release (the Neo will be available at the end of this month), you’ll also have the option to create custom profiles, on top of the four presets. Basically, all this comes together to create a product that’s modern and… maybe even cool?

But cool doesn’t count for anything if they don’t improve your hearing. I’ll admit, when I first tried these on a busy show floor, I couldn’t tell how well they were working. Later I tried them in our trailer here at CES and I had a much better experience. Eargo states these are designed for people with mild to medium hearing loss, which I feel is the category I’m in. That said, even in a more controlled environment, the “boost” to audio wasn’t quite what I was hoping for. It’s nearly there, but I find myself craving just a little more. The best I have tried in this regard is the Livio from Starkey. With those, the sound really feels like both my ears are balanced, whereas with the Neo it’s more like one good ear, and the other getting a bit of a leg up.

This might sound like a big negative. If the audio isn’t quite able to “repair” my hearing, then that surely is the main thing. It is, but then there’s so much other good stuff going on here, that I still think this is likely my favorite product out of all the ones I have tried which includes the Starkey, a Siemens model and one called “LifeEar” — plus various headphones that claim to enhance hearing also.

A decent hearing aid that you enjoy wearing is far better than a better one that you don’t (because ultimately you won’t). Perhaps when the app is more capable, or with some experimentation with bigger tips etc, I might find an even better configuration. The Neo is also primarily tuned for voice enhancement, and I did notice that that was improved, even if other ambient noises were still lacking.

One last selling point for the Neo? The price. The Eargo Neo cost $2,550 a pair. That might seem like a lot, but regular hearing aids can typically retail for (or upwards of) $2,000 each. That’s quite a difference. And if you assume that just means the Neo is a hearing “amplifier” (PSAP) then Eargo claims that it’s a Class 1 FDA-regulated hearing aid. Whether that means it works in the same way as something from one of the traditional manufacturers is unclear (the FDA’s definition of a “hearing aid” is broad).

For me, it’s just refreshing to see a company working to make a product that people actually want to use. If this sends a message to other manufacturers or creates a trend towards sleek, more usable products then that’s good for everyone. The Neo goes on sale at the end of this month.

X

AT&T will sever ties with location aggregators as well

SAN FRANCISCO, CALIFORNIA – SEPTEMBER 12, 2018: The entrance to an AT&T store in San Francisco, California. (Photo by Robert Alexander/Getty Images)

The move follows a report detailing the unregulated market for location data.

Earlier this week, a Motherboard report described just how it easy it was for anyone to get the location of another person’s phone. By handing over $300 to a bounty hunter, the publication was able to buy the location of a specific phone, which was accurate to within a few hundred meters. And the process showed just how flawed the data chain is between mobile carriers and the companies they provide location data to. Now, carriers are cutting ties with location aggregators, and AT&T is the latest to announce its plans to do so.

“Last year we stopped most location aggregation services while maintaining some that protect our customers, such as roadside assistance and fraud prevention,” AT&T said in a statement to CNET. “In light of recent reports about the misuse of location services, we have decided to eliminate all location aggregation services — even those with clear consumer benefits. We are immediately eliminating the remaining services and will be done in March.”

T-Mobile made a similar announcement yesterday, saying that it had already blocked location data requests from aggregator Zumigo (which was specifically mentioned in Motherboard’s report) and that it was almost done severing ties with other third-party data aggregators.

In June, Verizon, AT&T, Sprint and T-Mobile pledged to end the practice of selling location data through intermediary companies. The move came after reports revealed third parties were providing law enforcement officials access to cellphone location data without court orders. Following the reports, Senator Ron Wyden (D-OR) sent letters to the four major carriers demanding more information about the practices.

After Motherboard published its report, Wyden along with Senators Kamala Harris (D-CA) and Mark Warner (D-VA) spoke out about the revelations and FCC Commissioner Jessica Rosenworcel called for an investigation.

AT&T told CNET that its March cut off date was to ensure legitimate services would have time to transition.

Stocks to Watch: Earthstone Energy, Inc. (ESTE), Wayfair Inc. (W)

Earthstone Energy, Inc. (ESTE) stop its trading day at $6.30 with 5.53%. The firm exchanged a volume of 0.34 million shares at hands. In variance, the average volume was 0.18 million shares. At the time of calculation, Shares of the company recently traded 49.64% away 52-week low and noted price movement -47.41% away from the 52-week high level.

Many investors will opt to use several time periods when examining moving averages. Investors may also be paying close concentration to some simple moving average indicators on shares of Earthstone Energy, Inc. (ESTE). The moving average uses the sum of all of the previous closing prices over a certain time period and divides the result by the number of prices used in the calculation. Recently, the stock has been noticed trading 20.31% away from the 20-day moving average. Going toward to the 50-day, we can see that shares are currently trading -5.86% off of that figure. Zooming out to the 200-day moving average, shares have been seen trading -26.77% away from that value.

The Stock currently has a consensus recommendation of 1.70. This rating uses a scale from 1 to 5. A recommendation of 1 or 2 would represent a consensus Buy. A rating of 4 or 5 would indicate a consensus Sell. A rating of 3 would signify a consensus Hold recommendation.

Investors who are keeping close eye on Earthstone Energy, Inc. (ESTE) stock; watched recent volatility movements, they can see that shares have been recorded at 8.03% for the week, and 7.83% for the last month. Taking a look back at some historical performance numbers for Earthstone Energy, Inc. (ESTE), we can see that the stock moved 31.25% for the last five trades. For the last month, company shares are -7.22%. For the last quarter, the stock has performed -32.62%. Over the past full-year, shares have performed -44.74%. If we look back year-to-date, the stock has performed 39.38%.

Shares of the company have shown an EPS growth of -17.00% in the last 5 years. Its sales stood at 56.90% a year on average in the period of last five years. The company maintains price to book ratio of 0.60. A P/B ratio of less than 1.0 can indicate that a stock is undervalued, while a ratio of greater than 1.0 may indicate that a stock is overvalued. The company was able to keep return on investment at -8.40% in the last twelve months.

Wayfair Inc. (W) climbed 1.61% and its total traded volume was 1.5 million shares contrast to the average volume of 2.42 million shares. The stock closed its day at $98.32. The closing price represents the final price that a stock is traded for on a trading day. It’s the most up-to-date valuation until trading begins again on the next day. However, most financial instruments are traded after hours which mean that the closing price of a stock might not match the after-hours price. Regardless, closing prices are a useful tool that investors use to quantify changes in stock prices over time. The closing prices are compared day-by-day to look for trends and can measure market sentiment for any security over the course of a trading day.

The company maintained ROI for the last twelve months at -44.70%. The stock has a beta value of 1.86. Beta can be useful to gauge stock price volatility in relation to the broader market. For the past 5 years, the stock’s EPS growth has been nearly -37.70%.

Wayfair Inc. (W) observed trading 4.80% away from the 20-day moving average and 2.04% off from its 50-day simple moving average. Recently, the stock has been moved -6.32% from its 200-day simple moving average. Its revenue has grown at an average annualized rate of about 51.00% during the past five years. Its RSI (Relative Strength Index) reached 54.38. However its weekly volatility is 5.72% and monthly volatility is 6.17%.

Let’s take a gaze at how the stock has been performing recently. Wayfair Inc. (W) shares have moved 8.68% in the week and -6.16% in the month. Year to date is 9.15%, -23.85% over the last quarter, -18.54% for the past six months and 18.39% over the last 12 months. The average analysts gave this company a mean recommendation of 2.50. A rating of less than 2 means buy, “hold” within the 3 range, “sell” within the 4 range, and “strong sell” within the 5 range.

Stocks to Watch: Royal Gold, Inc. (RGLD), Etsy, Inc. (ETSY)

Royal Gold, Inc. (RGLD) stop its trading day at $84.41 with -0.55%. The firm exchanged a volume of 0.5 million shares at hands. In variance, the average volume was 0.54 million shares. At the time of calculation, Shares of the company recently traded 20.31% away 52-week low and noted price movement -14.33% away from the 52-week high level.

Many investors will opt to use several time periods when examining moving averages. Investors may also be paying close concentration to some simple moving average indicators on shares of Royal Gold, Inc. (RGLD). The moving average uses the sum of all of the previous closing prices over a certain time period and divides the result by the number of prices used in the calculation. Recently, the stock has been noticed trading 3.19% away from the 20-day moving average. Going toward to the 50-day, we can see that shares are currently trading 8.80% off of that figure. Zooming out to the 200-day moving average, shares have been seen trading 1.63% away from that value.

The Stock currently has a consensus recommendation of 2.10. This rating uses a scale from 1 to 5. A recommendation of 1 or 2 would represent a consensus Buy. A rating of 4 or 5 would indicate a consensus Sell. A rating of 3 would signify a consensus Hold recommendation.

Investors who are keeping close eye on Royal Gold, Inc. (RGLD) stock; watched recent volatility movements, they can see that shares have been recorded at 1.75% for the week, and 2.90% for the last month. Taking a look back at some historical performance numbers for Royal Gold, Inc. (RGLD), we can see that the stock moved -0.27% for the last five trades. For the last month, company shares are 7.61%. For the last quarter, the stock has performed 10.73%. Over the past full-year, shares have performed 1.36%. If we look back year-to-date, the stock has performed -1.45%.

Shares of the company have shown an EPS growth of -25.90% in the last 5 years. Its sales stood at 9.70% a year on average in the period of last five years. The company maintains price to book ratio of 2.62. A P/B ratio of less than 1.0 can indicate that a stock is undervalued, while a ratio of greater than 1.0 may indicate that a stock is overvalued. The company was able to keep return on investment at -2.40% in the last twelve months.

Etsy, Inc. (ETSY) declined -2.06% and its total traded volume was 2.08 million shares contrast to the average volume of 2.88 million shares. The stock closed its day at $52.77. The closing price represents the final price that a stock is traded for on a trading day. It’s the most up-to-date valuation until trading begins again on the next day. However, most financial instruments are traded after hours which mean that the closing price of a stock might not match the after-hours price. Regardless, closing prices are a useful tool that investors use to quantify changes in stock prices over time. The closing prices are compared day-by-day to look for trends and can measure market sentiment for any security over the course of a trading day.

The company maintained ROI for the last twelve months at 7.50%. The stock has a beta value of 0.87. Beta can be useful to gauge stock price volatility in relation to the broader market. For the past 5 years, the stock’s EPS growth has been nearly 81.50%.

Etsy, Inc. (ETSY) observed trading 5.24% away from the 20-day moving average and 8.55% off from its 50-day simple moving average. Recently, the stock has been moved 26.63% from its 200-day simple moving average. The institutional ownership stake in the corporation is 92.70%. Its revenue has grown at an average annualized rate of about 42.70% during the past five years. Its RSI (Relative Strength Index) reached 55.94. The debt-to-equity ratio (D/E) was recorded at 0.71. However its weekly volatility is 5.30% and monthly volatility is 5.83%.

Let’s take a gaze at how the stock has been performing recently. Etsy, Inc. (ETSY) shares have moved 12.28% in the week and -2.13% in the month. Year to date is 10.93%, 22.75% over the last quarter, 20.51% for the past six months and 159.69% over the last 12 months. The average analysts gave this company a mean recommendation of 2.20. A rating of less than 2 means buy, “hold” within the 3 range, “sell” within the 4 range, and “strong sell” within the 5 range.

3 Contrarian Stocks To Watch In 2019

“Bull markets are born in pessimism, grow on skepticism, mature on optimism and die on euphoria. The time of maximum pessimism is the best time to buy, and the time of maximum optimism is the best time to sell.”

The above quote came from John Templeton, who made a name for himself during the height of the great depression in 1939 by going against the grain (or popular thinking). Templeton, while only in his late twenties, made and cemented his contrarian reputation by entering into a series of — what were considered at the time to be — unusual investments.

He bought $100 worth of every stock that traded under $1 on both the American and the New York stock exchanges, spending $10,400 for an equity position in 104 companies. Those companies he invested in were wallowing under $1 per share, presumably unloved by the market. So, he took a contrarian view. Out of the 104 companies, a whopping 34 went bankrupt. But the remaining 70 companies did well enough that Templeton was able to sell his shares only four years later for nearly four times the $10,400 he had initially invested.

Some economists have credited Templeton for establishing what became known today as a mutual fund. Those who follow his investing style credit him for affirming the importance of avoiding “the herd mentality.” Does it pay to be a market contrarian today? Absolutely. Advanced Micro Devices (AMD) was trading for less than $2 in early 2016. It reached $34 last September and still trades north of $20 today. And the stock market’s plunge in recent months has created basket of AMD-type opportunities. Using Templeton’s contrarian strategy, here are a few names worthy of betting on.

Snap (SNAP) — Price $6.28 – One-year price target $10

Although the company is having a tough time thwarting off larger rival Facebook (FB), Snap shares are now cheap enough where an M&A seems plausible. SNAP stock dipped below $5 per share last month, reaching $4.82, but has since risen as high as 33% to $6.45. SNAP must nonetheless figure out how to better monetize its platform, and show increase engagement before investors will get excited about the stock. From current levels, however, the risk-versus-reward scenario has turned positive, especially given the likelihood that one of the FAANG giants may pick it off in a cheap acquisition.

AK Steel (AKS) — Price $2.76 – One-year price target $5.50

Although the prospect of the steel industry haven’t improved that drastically, thanks to the trade war between the U.S. and China, it’s still amazes to me to see the extent to which AK Steel shares have been punished. The stock has lost 40% of its value in three months, while losing 55% over the past year. These declines don’t mesh with the Market Vectors Steel ETF (SLX), which has lost just 23% over the past year.

AK Steel is working on its new line of next-generation advanced high-strength steel products such as its NEXMET brand, which should differentiate its business from competitors, while also reducing its dependence on commodity steel. And with the prospect of a trade agreement around the corner, AK Steel stock looks like a strong bargain, given that China is one of the world’s largest consumers of steel.

Chesapeake Energy (CHK) — Price $2.76 – One-year price target $4.35

The extent to which Chesapeake can mount a meaningful recovery in a brutal oil environment is the the company’s biggest question mark. That is one of many concerns for investors. Although the natural gas and upstream giant continues to make modest improvements with its balance sheet, the lack of stability with oil prices makes CHK highly speculative. It doesn’t appear as if industry improvement plans by OPEC (Organization of Petroleum Exporting Countries), including talks of production cuts, will immediately change the course.

On the bright side, Chesapeake is now delivering positive free cash flow. And with plans to continue to trim capital expenses, the company’s liquidity crisis is not as dire as it were a year ago. And with some luck and a rebound in energy prices, Chesapeake should continue to benefit going forward and achieve its goal of improving EBITDA.

7 Stocks To Watch For January 10, 2019

Some of the stocks that may grab investor focus today are:

  • KB Home KBH 4.46% reported stronger-than-expected earnings for its fourth quarter. KB Home shares surged 3.78 percent to $22.81 in the pre-market trading session.
  • Wall Street expects SYNNEX Corporation SNX 1.77% to post quarterly earnings at $3.09 per share on revenue of $5.43 billion after the closing bell. SYNNEX shares rose 2.23 percent to close at $85.26 on Wednesday.
  • Zumiez Inc. ZUMZ 7.66% reported a 4.9 percent rise in comparable sales for December and raised its Q4 guidance. Zumiez shares jumped 10 percent to $23.40 in the pre-market trading session.
  • Bed Bath & Beyond Inc BBBY 16.64% reported upbeat profit for its third quarter and issued strong earnings forecast for 2019. Bed Bath & Beyond shares climbed 16.8 percent to $14.32 in the pre-market trading session.
  • Analysts expect FuelCell Energy, Inc. FCEL 2.36% to report a quarterly loss at $0.18 per share on revenue of $16.60 million before the opening bell. FuelCell Energy shares rose 7.2 percent to $0.60 in pre-market trading.
  • Diana Containerships Inc DCIX 38.36% reported a $6 million common share buyback program. Diana Containerships shares jumped 57.23 percent to $1.25 in the pre-market trading session.
  • Simulations Plus, Inc. SLP 6.82% reported weaker-than-expected earnings for its first quarter on Wednesday. Simulations Plus shares dipped 6.77 percent to $19.00 in the pre-market trading session.