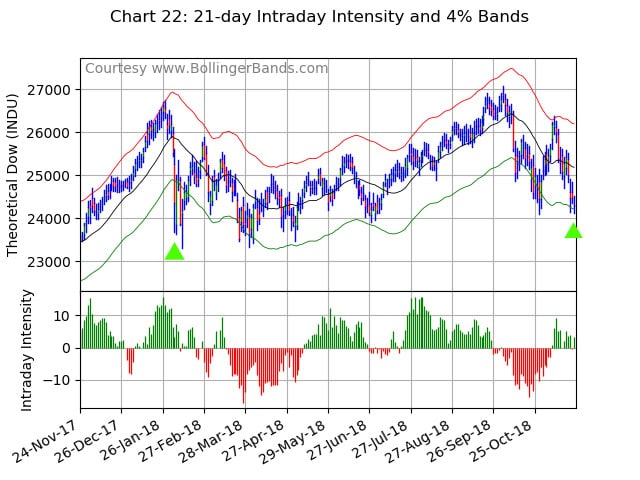
Market-timing system’s previous buy sign occurred at the January 2018 lows
Last week my market-timing system generated two rare buy signals — one on November 21st and one on the 23rd. These signals are worth a second look as the last buy signals generated by this system occurred at the U.S. market’s January 2018 lows. Will these signals mark the lows in this cycle as well? So far, so good; but we will only know in the fullness of time.
In that context, it’s worth a close look at the trading system that generated them. When I began my career in technical analysis there was a popular market-timing system that employed the Dow Jones Industrial Average DJIA, -0.64% , a set of trading bands, and two market-breadth oscillators. This was before the calculation of the Dow was available in real time. At the end of the day the closes of each of the 30 stocks were averaged to get the closing value for the Dow. The same was done with the opening prices to get the open of the Dow.
The high and low for the Dow were another story. In those days the highest highs and lowest lows for each of the stocks that day were used to calculate the high and low of the average. Together these numbers were published in the Wall Street Journal as the official and most important indicator of the level of the stock market.
Around 1982 the real-time calculation that we use today began and the highest and lowest intra-day calculated values became the official high and low of the average. This resulted in narrower ranges for the Dow from that time forward. Some analysts thought that the old calculation, called the theoretical Dow today, still had value and kept up the calculation. Among them was the late Jerry Smith of AIQ Systems who introduced me to the idea that the theoretical Dow had analytical value, especially when used in the calculation of oscillators that used its high and low values.
The goal of that market timing system was to identify important high- and low points in the market by comparing the price action of the Dow to the action of a couple of market-breadth oscillators (for the remainder of this article the Dow refers to the theoretical Dow). Relatively high and low for the Dow was defined by using percentage trading bands, in this case a 21-day moving average shifted up and down by four percent. Sell signals occurred when the theoretical high touched the upper band and one or both of the oscillators was negative. Buy signals were the opposite.
The oscillators used were a 21-day advance-decline oscillator that was calculated by subtracting the number of NYSE issues declining on the day from those advancing and keeping a 21-day sum of those net values. A similar oscillator was created using the volumes of NYSE stocks up and down on the day.
That system worked well for many years but as the 1980s progressed it gradually became less effective and was eventually forgotten. Changes in market structure were to blame; the introduction and subsequent popularity of stock-index futures, index options, program trading, and the like.
Over the years I kept that market timing system in mind as a sort of template. For use on individual stocks I substituted a volume indicator, David Bostian’s Intraday Intensity. Then, to avoid having to continuously adjust the width of the bands to suit market conditions and/or different securities I substituted Bollinger Bands. It was the problem of having to adjust percentage trading bands that led me to create Bollinger Bands, specifically the need to make the bands adaptive to changing market conditions.
In the back of my mind I kept thinking about the value of the theoretical Dow calculation for indicators, so when I built a market timing chart pack for weekly review I developed a modernized version of that classic system. I used the theoretical Dow, a 21-day moving average, four percent trading bands, and Intraday Intensity calculated using the theoretical Dow. As the theoretical Dow is hard to come by, I contacted Richard Dale at NorgateData who agreed to add the theoretical calculation to their database.
A word about the volume indicator Intraday Intensity: It is based on where the close occurs in the day’s range; in the upper portion of the range it adds a proportional amount of volume to the indicator, in the lower portion of the range it subtracts volume from the indicator, and a close in the middle portion of the daily range leaves the indicator nearly unchanged. The idea is to track institutional buyers and sellers who push a stock to near its daily highs when they are accumulating stock and to near its daily lows when they are distributing. Volume indicators in general track supply and demand, or accumulation and distribution, and Bostian’s formulation is the best of the lot in my opinion.

Monday’s U.S. stock market action provided some confirmation of the signals, but we will need to see concerted positive price action confirming before we can say that we have seen an “all clear” signal.


