Stock Markets
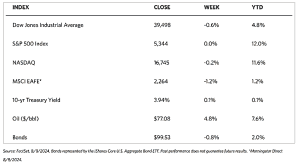
The major indexes closed modestly lower for the week. According to the Wall Street Journal markets weekend report, the 30-stock Dow Jones Industrial Average (DJIA) gave up 0.60% while the Total Stock Market Index fared slightly better as it pulled back by only 0.07%. The broad S&P 500 Index slid by 0.04% with both mid- and small-caps losing ground. The technology-heavy Nasdaq Stock Market Composite lost by 0.18%. The NYSE Composite was the only major index to register a gain, chalking up a 0.58% gain. The CBOE Volatility Index (VIX), which indicates the market’s risk perception, dropped by 12.91% after it briefly spiked on Monday to 65.73, its highest since 2020. The VIX ended the week at 20.69.
Factors that partly account for the swings are technical considerations and programmed trading strategies, among others. A recent hike in Japanese short-term interest rates, although modest, appears to cause a partial unwind in the so-called carry trade. Investors borrow at near-zero interest rates in Japan and invest the funds in higher-yielding assets in the U.S. and other countries. Conversely, short-covering (the need to hedge bets that stocks will further fall) appeared to help stocks move off their lows on Monday afternoon; stock buybacks also provided some support. Another factor that exacerbated volatility may have been the summer vacation season which kept some longer-term investors away from the market.
U.S. Economy
Some fundamental factors that may have contributed to the market volatility are the continuing concerns regarding the previous week’s downside economic surprises. Paramount among these shocks were the surprise increase in the employment rate and negative manufacturing signals. Several major companies reported signs of weakening consumer demand in earnings calls. A bounce-back rally on Thursday seemed to be attributable to a reassuring drop in weekly jobless claims. During the rally, the S&P 500 scored its best daily gain since November 2022. The weekly jobless claims fell to 233,000 from an upwardly revised 250,000. The number of continuing claims rose slightly, however, by 6,000 to 1.875 million. Investors and analysts appeared to take a second look at the previous week’s increase in the household employment survey. Reconsideration was focused particularly on the role played by Americans and recent migrants who were not included in the weekly claims data and who are newly reporting that they are looking for work.
There are other reasons that the job market might be stronger than the headline unemployment data suggest. First, there may be an increase in the number of individuals who were not able to work due to the inclement weather. Second, there may be a rise in temporary layoffs, where the affected employees may be called back to work in the next two months. After the initial shocks, it appears that a near-term recession is unlikely, and the latest inflation and labor market data have met the requirements of the Fed to start cutting interest rates. The first cut may be in September, with possibly up to two more rate cuts before the year ends. As fears dissipate over a weakening labor market, the yield on the benchmark 10-year Treasury increased over the week.
Metals and Mining
The spot prices of precious metals were mixed. Gold closed this week at $2,431.32 per troy ounce, lower by 0.49% from last week’s close at $2,443.24. Silver last traded at $27.46 per troy ounce for a loss of 3.85% from the previous week’s close at $28.56. Platinum ended at $925.47 per troy ounce, 3.59% down from last week’s close at $959.95. Palladium ended trading this week at $909.67 per troy ounce for a gain of 1.61% from the previous week’s closing price of $895.22. The three-month LME prices of industrial metals were also mixed. Copper (per MT) (LME) came from the previous week’s closing price of $9,055.50 to end at $8,794.50 per metric ton for a 2.88% drop. Aluminum came from its previous weekly close of $2,263.50 to settle at $2,274.00 per metric ton for a gain of 0.46%. Zinc, which last traded the week before at $2,653.00 per metric ton, closed this week at $2,646.00 for a dip of 0.26%. Tin, which previously closed at $30,188.00, last traded this week at $30,494.00 per metric ton for a gain of 1.01%.
Energy and Oil
Monday’s giant stock selloff rocked the markets, but oil prices appear to be recovering from four straight week-over-week losses to finally arrive at a much-needed weekly rise. ICT Brent hovers close to the $80 per barrel mark once more, while fears of a coming economic recession were somewhat calmed by stronger US jobs data. Markets continue to anticipate news about Iran’s retaliation against Israel, and the overall geopolitics continue to add some bullish incentive to the oil market. Tensions continue to run high across the Middle East. The Greek-owned Delta Blue tanker carrying Iraqi oil to Greece’s Corinth Port has survived two grenade attacks, one missile strike, and a maritime drone ramming attempt, totaling four attacks in the past 24 hours.
Natural Gas
For the report week beginning Wednesday, July 31, and ending Wednesday, August 7, 2024, the Henry Hub spot price rose by $0.06 from $1.93 per million British thermal units (MMBtu) to $1.99/MMBtu. Regarding Henry Hub futures, the price of the September 2024 NYMEX contract increased by $0.076, from $2.036/MMBtu at the start of the report week to $2.112/MMBtu at the end of the week. The price of the 12-month strip averaging September 2024 through August 2025 futures contracts rose by $0.034 to $2.939/MMBtu.
International natural gas futures increased this report week. The weekly average front-month futures prices for liquefied natural gas (LNG) cargoes in East Asia increased by $0.15 to a weekly average of $12.50/MMBtu. Natural gas futures for delivery at the Title Transfer Facility (TTF) in the Netherlands, the most liquid natural gas market in Europe, increased by $1.08/MMBtu to a weekly average of $11.78/MMBtu. In the week last year corresponding to this report week (the week starting August 2 and ending on August 9, 2023), the prices were $10.98/MMBtu in East Asia and $10.35/MMBtu at the TTF.
World Markets
European stocks recovered from sharp losses earlier in the week to end slightly higher upon the close of trading for the week. The pan-European STOXX Europe 600 Index climbed back from its deep drop to end 0.27% higher for the week. Major regional indexes were mixed. France’s CAC 40 Index gained by 0.25% while Germany’s DAX outperformed with slightly a 0.35% climb. Italy’s FTSE MIB fell by 0.74%. The UK’s FTSE 100 Index was hardly changed. Climbing from lows earlier this week are the Eurozone government bond yields after a global market rout sparked by worries about the sustainability of economic growth. Helping to allay these concerns was a news release showing a notable drop in U.S. jobless claims which had been worsened by weak U.S. manufacturing and jobs data. In the eurozone, retail sales volumes declined unexpectedly by 0.3% in June after increasing to 0.1% in May. A drop in the sales of food, drinks, and tobacco accounted for the weakness in the indicator. The data shows that customers may be taking longer to recover from the inflationary squeeze, contributing to doubts regarding the strength of second-quarter demands.
Japanese stocks experienced the most severe one-day sell-off in decades at the start of the week. The plunge was driven by a rebounding yen resulting from the hawkish turn taken by the Bank of Japan (BoJ) at its July meeting. The central bank raised interest rates while simultaneously detailing plans to taper its bond purchases. Risk appetite was dampened by concerns that global growth is slowing down, and investors continued the rapid unwinding of the yen carry trade (where they borrow yen at Japan’s ultralow interest rates to invest in a higher-yielding foreign market) in anticipation of a narrowing in US-Japan rate differentials and a stronger yen. Despite the steep drop, Japan’s markets had recovered most of their losses by the end of the week, with the Nikkei 225 Index and the broader TOPIX Index down by 2.5% and 2.1% respectively. The global reverberation caused by Japan’s market volatility was allayed to some degree by dovish comments by BoJ Deputy Governor Shinichi Uchida when he stated that the BoJ will not raise interest rates while the markets are unstable. This reduced the likelihood that interest rates would be hiked soon. Nevertheless, the pronouncement weakened the yen which ended the week at the low end of the JPY 147 range against the USD from the previous week’s mid-JPY 146 range.
China’s stocks plunged as the increase in consumer prices, which proved stronger than expected, failed to offset worries about deflationary pressures. The Shanghai Composite Index dropped by 1.48% and the blue-chip CSI 300 lost by 1.56%. The Hong Kong benchmark Hang Seng Index rose by 0.85%. From a year earlier, China’s consumer price index rose by 0.5% in July, an increase over June’s 0.2% rise. The increase was attributed by analysts to seasonal factors, including bad weather conditions and a low base for pork prices in 2023. Core inflation (which excludes volatile food and energy costs) rose by 0.4% down from 0.6% in June and registering the lowest growth since January. The producer price index fell by 0.8% year-on-year, unchanged from June, and marking the 22nd consecutive monthly decline. In economic news, China’s imports in July rose by 7.2% from last year, exceeding expectations and up from a 2.3% decline in June. July exports rose by a lower-than-expected 7%, with the shortfall being attributed to sluggish demand. The decline in exports raised key worries regarding softening global demand which has key repercussions for China’s economy this year. In the past, strong global demand compensated for sluggish domestic demand.
The Week Ahead
Retail sales and two key inflation readings, namely the CPI and the PPI, are among the important economic releases expected to come out in the coming week.
Key Topics to Watch
- Monthly U.S. federal budget for July
- NFIB optimism index for July
- Producer price index for July
- Core PPI for July
- PPI year over year
- Core PPI year over year
- Consumer price index for July
- CPI year over year
- Core CPI for July
- Core CPI year over year
- Initial jobless claims for Aug. 10
- Empire State manufacturing survey for Aug.
- Philadelphia Fed manufacturing survey for Aug.
- U.S. retail sales for July
- Retail sales minus autos for July
- Import price index for July
- Import price index minus fuel for July
- Industrial production for July
- Capacity utilization for July
- Business inventories for June
- Consumer sentiment (prelim) for Aug.
- Housing starts for July
- Building permits for July
- Home builder confidence index for July
Markets Index Wrap-Up