Stock Markets
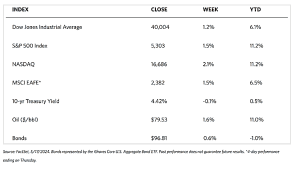
For the first time ever, the 30-stock Dow Jones Industrial Average (DJIA) penetrated the 40,000 level and closed above it. Major stock indexes were up slightly for the week. The DJIA is up by 1.24% while the Total Stock Market is up by 1.55%. As if to confirm the latter, the broad-based S&P 500 Index gained 1.54%. On the other hand, the technology-heavy Nasdaq Stock Market Composite outperformed by climbing 2.11%. The NYSE Composite Index climbed by 1.25%. The rally was across the board, with small, mid, and large-cap indexes advancing for the week. The risk perception indicator, the CBOE Volatility Index (VIX) came down by 4.46%.
The week was memorable not only for the DJIA, a narrow index but also for the S&P 500 Index and the Nasdaq Composite which are relatively broad. All three climbed to record highs during the week. This may be traced to fading inflation and interest rate concerns, the outperformance of growth stocks, and in part possibly the lower implied discount placed on future earnings. Wednesday’s release of the Labor Department’s April consumer price index (CPI) appeared to be the major factor that drove the week’s positive sentiment. The CPI came in at or slightly below expectations which boosted some hope that rate cuts may come soon.
U.S. Economy
The April CPI contrasted with the hotter-than-expected readings of the previous three months. Headline prices rose by 0.3% which is a tick below expectations, and core prices (which excludes food and energy) rose by 0.3% in line with expectations. Inflation was concentrated in service prices, particularly transportation services costs which rose by 11.2% over the past year and 0.9% over the month. Retail sales figures released on Thursday were bad news for the economy but good news for stocks and inflation. As reported by the Commerce Department, retail sales remained flat in April compared to the consensus estimate of a 0.4% gain. The Commerce Department also revised its estimate of March sales lower, from 0.7% to 0.6%. The evidence shows that consumers were pulling back on discretionary spending. Sales at restaurants and bars continued to moderate and even fell slightly when taking account of higher prices since retail sales data are not adjusted for inflation. Meanwhile, sales at non-store (mostly online) retailers fell by 1.2%. Overall, while inflation remains too high above the target of 2%, the latest data signals that consumer price pressures are gradually abating.
Metals and Mining
Silver cleared the $30 resistance level ended this week above $31 per ounce, its highest close in 11 years. Prices of the white metal were also up by 11% for the week, marking its best performance since early August 2020. But silver was not the only stellar performer. Gold performed strongly on Friday, apparently closing its consolidation period and ending the week above the $2,400-per-ounce resistance level. Expectations are growing that it will not be long before gold will test its new all-time high at $2,500 per ounce as it is exhibiting enough momentum for it. Among industrial metals, copper also ended the week at an all-time high, above $5 per pound. Investors find it encouraging that gold and silver are finally moving in a traditional manner. Despite the excitement caused by silver, investors defer to gold as the asset analysts recommend to watch as a safe-haven asset. Thus far, its enduring appeal is highlighted by the convergence of billionaires’ renewed interest, technical bullish patterns, cautious market sentiment, and evolving global dynamics. Analysts expect that this is just the start of the bull market for gold.
The spot prices of precious metals ended higher for the week. Gold ended at $2,415.22 per troy ounce, higher by 2.32% over last week’s close of $2,360.50. Silver closed at $31.49 per troy ounce, 11.75% higher than last week’s closing price of $28.18. Platinum last traded at $1,085.41 per troy ounce, 8.80% above last week’s ending at $997.63. Palladium closed at $1,012.00 per troy ounce, 3.26% higher than the previous week’s close at $980.03. The three-month LME prices of industrial materials also ended above their closes last week. Copper gained 4.20% over its last price one week ago at $10,004.00 to end this week at $10,424.00 per metric ton. Aluminum gained 2.25% over last week’s close at $2,529.50 when it ended this week at $2,586.50 per metric ton. Zinc inched up by 1.01% from its last trading price of $2,930.50 one week ago to close this week at $2,960.00 per metric ton. Tin ended the week 5.10% higher than last week’s close of $32,093.00 to end this week at $33,729.00 per metric ton.
Energy and Oil
The price of crude continues to trend within a rather narrow range between $82 and $84 per barrel over this month. Brent futures continue to be rangebound despite this week’s improving macroeconomic outlook. Even so, sufficient support for a breakout next week may be provided by U.S. inflation slowing down to a monthly rate of 0.3% and a slight U.S. oil inventory drop. In the meantime, the International Energy Agency (IEA) lowered its crude oil demand forecast for 2024 to 1.06 million barrels per day (b/d), a reduction of $140,000 b/d. The new demand forecast is half of OPEC’s 2,25 million b/d call for this year and cited poor industrial activity and weaker diesel consumption.
Natural Gas
For the report week from Wednesday, May 8 to Wednesday, May 15, 2024, the Henry Hub spot price rose by $0.14, from $2.01 per million British thermal units (MMBtu) to $2.15/MMBtu. Regarding Henry Hub futures, the price of the June 2024 NYMEX contract increased by $0.229, from $2.187/MMBtu at the start of the report week to $2.416/MMBtu at the week’s end. The price of the 12-month strip averaging June 2024 through May 2025 futures contracts rose by $0.082 to $3.049/MMBtu.
International natural gas futures prices were mixed for this report week. The weekly average front-month futures prices for LNG cargoes in East Asia were the same week-over-week at a weekly average of $10.46/MMBtu. Natural gas futures for delivery at the Title Transfer Facility (TTF) in the Netherlands, the most liquid natural gas market in Europe, decreased by $0.27 to a weekly average of $9.50/MMBtu. By comparison, in the week last year corresponding to this week (the week from May 10 to May 17, 2023), the prices were $10.62/MMBtu in East Asia and $10.44/MMBtu at the TTF.
World Markets
The pan-European STOXX Europe 600 Index climbed during the week to hit a record high but came down to register a 0.42% gain for the week. Optimism about the extent to which monetary policy might ease this year appeared to have been cooled by cautious comments from members of the European Central Bank (ECB). Major stock indexes ended mixed. Italy’s FTSE MIB advanced by 2.14% while Germany’s DAX fell by 0.36% and France’s CAC 40 Index slid by 0.63%. The UK’s FTSE 100 Index ended with a modest decline. Policymakers at the European Central Bank (ECB) caution that while a rate cut is still likely in June, the path thereafter remains uncertain. This is due to current data not justifying another reduction in July because the disinflation process appears to have significantly slowed. Should the Federal Reserve further slow policy easing, this could further delay ECB moves to reverse rates, and therefore would not back a second rate cut in July. Industrial production rose for the second consecutive month in March, climbing by 0.6% sequentially. The stronger-than-expected figure, however, was attributed to a jump in Ireland’s output, a metric that has proven historically quite volatile.
Japan’s stock markets gained ground for the week. The Nikkei 225 Index advanced 1.5% while the broader TOPIX Index added 0.6%. The gains were realized against a backdrop of economic weakness and a range-bound yen on expectations of U.S. interest rate cuts. Meanwhile, tentative hawkishness overshadowed policy signals by the Bank of Japan (BoJ) which also launched Japanese government bond (JGB) yields modestly higher. Investors generally discounted the weaker-than-expected quarter gross domestic product report – a 2.0% annualized contraction on the previous three-month period – that was in part driven by the negative impact on growth of the earthquake that hit the Noto peninsula in January. Other areas of weakness include the suspension of some auto production activity, as well as capital expenditure and external demand. Conversely, some support was shored up by strength in public demand and private inventories. The range-bound yen (at approximately JPY 155 versus the USD) continues to languish at near-record lows despite expectations by investors that Japanese authorities may intervene to support the currency, something already suspected to have happened twice by market observers.
Chinese equities hardly reacted despite the unveiling of a historic rescue package by the central government last Friday. The package aimed to stabilize China’s ailing property sector, but its announcement resulted in the Shanghai Composite Index remaining broadly flat, although the blue-chip CSI 300 inched up by 0.32%. Hong Kong’s benchmark Hang Seng Index, on the other hand, gained by 3.11%. In the package, the People’s Bank of China (PBOC) reduced the minimum down payment ratio by 5% to 15% for first-time buyers and to 25% for second-home purchases to try to enhance demand for home purchases. The PBOC also announced that it would eliminate the nationwide floor level of mortgage rates and allow cities to decide what mortgage rates to charge. The PBOC said that under a so-called re-lending program, it would extend RMB 300 billion in low-cost funds to a select group of state-owned banks to lend to local state-owned entities for the purchase of unsold homes. Data showed no signs of a turnaround so far in China’s yearslong housing crisis despite past measures taken, thus the release of this unprecedented support package. According to the statistics bureau, new home prices fell by 0.6% month-on-month in April, the tenth straight monthly decline and the steepest drop since November 2014.
The Week Ahead
Data on home sales, initial jobless claims, and the S&P Global Manufacturing and Services PMI are among important economic releases scheduled for this week.
Key Topics to Watch
- Fed Chair Powell prerecorded commencement remarks (May 19)
- Fed Vice Chair for Supervision Michael Barr speaks (May 20)
- Fed Gov Christopher Waller gives welcoming remarks (May 20)
- Fed Vice Chair Philip Jefferson speaks (May 20)
- Fed Gov Christopher Waller speaks (May 21)
- Fed Vice Chair for Supervision Michael Barr speaks (May 21)
- Cleveland Fed President Loretta Mester, Atlanta Fed President Raphael Bostic and Boston Fed President Susan Collins speak together on panel (May 21)
- Existing home sales for April
- Minutes of Fed’s May FOMC meeting
- Initial jobless claims for May 18
- S&P flash U.S. services PMI for May
- S&P flash U.S. manufacturing PMI for May
- New home sales for April
- Atlanta Fed President Raphael Bostic speaks (May 23)
- Durable goods orders for April
- Durable goods minus transportation for April
- Fed Gov Christopher Waller speaks (May 23)
- Consumer sentiment (final) for May
Markets Index Wrap-Up