Stock Markets
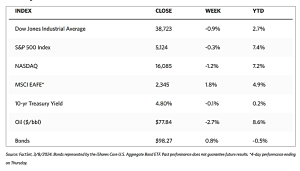
Major indexes ended slightly down this week. The Dow Jones Industrial Average (DJIA) shaved off 0.93% while the Dow Jones Total Stock Market dipped by 0.21%. The broad-based S&P 500 Index came down by 0.26% while the technology-tracking Nasdaq Stock Market Composite fell even further, losing by 1.17%. On the other hand, the NYSE Composite bucked the trend to close higher by 0.91%. Investor risk perception, as measured by the CBOE Volatility Index (VIX), climbed by 12.43% in reaction to increased uncertainties in the market.
The week began with a sell-off on Tuesday, as the S&P 500 fell by more than 1% for the first time since mid-February due to disappointing policy announcements from China. Stocks regained upward momentum by midweek, however, as the large-cap S&P 500 and the S&P MidCap 400 shot to new record intraday highs alongside the Nasdaq Composite this week. The strong surge was attributable to growing expectations that the Federal Reserve may begin to cut interest rates sooner than previously speculated. Small-cap and value shares outperformed. On the contrary, mega-cap shares lagged partly due to a decline in Apple following reports that iPhone sales were slowing in China. This was also the reason that Nasdaq underperformed the broader indexes. Despite this apparent breakout, most of the market reacted to higher-than-expected unemployment reports by the week’s end.
U.S. Economy
Over the week, some vital economic data weighed on the markets. Most notably, the U.S. unemployment rate was recorded at its highest level in two years. The U.S. nonfarm-jobs report was mixed but overall, it pointed to a cooling labor market. While the total jobs added in February totaled 275,000 which exceeded the targeted 200,000, the previous month’s reading was adjusted sharply lower, from 353,000 to 229,000. Also, the unemployment rate climbed from 3.7% to 3.9%, nearing its highest in two years. The nonfarm payrolls report revealed a weaker-than-forecast February ADP private-payrolls report. This revealed a total of 140,000 jobs added, which was short of the expected 150,000.
Another report released over the week was the ISM Manufacturing and Services data. These ISM data showed a sharp pullback in the employment indexes, indicating a contraction in the manufacturing and services sectors of the economy. The ISM data are comprehensive surveys of supply-management fundamentals and are taken by analysts to be leading indicators of the economy’s manufacturing and services industries. Regarding the manufacturing sector, this is the fifth consecutive monthly contraction of the ISM Employment index, with 10 industries reporting a decrease in employment and four industries reporting employment growth in February. The ISM Employment index in the services sector showed contraction for the second time in three months. Nine industries reported a decrease while six appointed an increase, and some indicated that they intend to increase hiring later in the year.
Metals and Minin
The precious metals markets, particularly regarding gold prices, surged to a new high this week. The underlying strength in gold is attributed to the anticipation of a Federal Reserve cut in interest rates by June. This past week, Fed Chair Jerome Powell hinted at the Central Bank’s possible rate reduction in the next few months, boosting market confidence and pushing gold to a new high of $2,152 in international markets on Wednesday. Speculation on the prospective rate cuts has sparked bullish sentiments in domestic and international markets, goading gold prices even higher after breaking out beyond its long-term resistance level.
The spot prices of precious metals rallied to record highs. Gold rose to $2,178.95 per troy ounce, which is 4.61% higher than last week’s close at $2,082.92. Silver closed at $24.31 per troy ounce, 5.15% over the closing price last week of $23.12. Platinum closed this week at $914.49 per troy ounce, rising 2.95% above the previous week’s close at $888.26. Palladium ended last week at $1,023.63 per troy ounce, gaining 6.85% above the previous week’s ending price of $958.04. The three-month LME prices of base metals followed the same trend as precious metals. Copper, which closed the previous week at $8,493.50, ended this week at $8,640.50 per metric ton, gaining 1.73% for the week. Aluminum, which last traded at $2,228.00 the previous week, closed this week at $2,253.00 per metric ton for a gain of 1.12%. Zinc, which previously closed at $2,426.00, ended this week at $2,535.00 per metric ton for a rise of 4.49%. Tin, which was previously priced at $26,556.00, had a closing price this week of $27,607.00 per metric ton for a weekly gain of 3.96%.
Energy and Oil
Oil prices continued on their flatlining this week, unaffected by positive trade data out of China, and strong Indian oil demand. The continued build-up in U.S. crude inventories and the skepticism surrounding extended voluntary cuts by OPEC+ worked to offset what would have been the positive momentum in crude. February 7 marked the date when ICE Brent futures settled outside the $80-85 per barrel bandwidth for the last time. They suggest that the price movement this week marks a month-long sideways movement for oil. In the meantime, Red Sea hostilities claimed their first casualties as three sailors died in the Houthi’s attack on the Greek-owned Barbados-flagged dry bulk tanker True Confidence. The incident occurred some 50 nautical miles off the coast of Arden.
Natural Gas
For the report week covering February 28 to March 6, 2024, the Henry Hub spot price climbed $0.03 from $1.63 per million British thermal units (MMBtu) to $1.66/MMBtu. Regarding the Henry Hub futures, the price of the April 2024 NYMEX contract increased by $0.044, from $1.885/MMBtu at the start of the report week to $1.929/MMBtu at the end of the week. The price of the 12-month strip averaging April 2024 through March 2025 futures contracts rose by $0.012 to $2.829/MMBtu.
International natural gas futures prices climbed this week. The weekly average front-month futures prices for liquefied natural gas (LNG) cargoes in East Asia increased by $0.10 to a weekly average of $8.36/MMBtu. Natural gas futures for delivery at the Title Transfer Facility (TTF) in the Netherlands rose by $0.74 to a weekly average of $8.38/MMBtu. In the week last year corresponding to this week (the week from March 1 to March 8, 2023), the prices were $14.21/MMBtu in East Asia and $13.66/MMBtu at the TTF.
World Markets
European stocks were up this week as the pan-European STOXX Europe 600 Index climbed for the seventh consecutive week. The Index broke out to hit a record high on its way to a 1.14% gain for the week. The major indexes surged this week. Italy’s FTSE MIB added 1.43%, France’s CAC 40 Index gained 1.18%, and Germany’s DAX inched up by 0.45%. Bucking the trend was the UK’s FTSE 100 Index slid down by 0.30%. The ten-year government bond yields for Germany, Italy, and France declined in reaction to the European Central Bank (ECB) retaining its monetary policy unchanged and signaling that interest rates could be cut in June. The ECB revised its inflation and economic growth forecasts downward while leaving its key deposit rate unchanged at 4.0%. They also indicated that discussions have begun on dialing back restrictive policy later in the year. The ECB President Christine Lagarde stated that “good progress” has been realized toward the 2.0% inflation target, but also cautioned that the Governing Council still needed to confirm that the reduction in inflation was sustainable.
Japanese stocks ended mixed over the week. The Nikkei 225 Index closed 0.56% lower while the broader TOPIX Index gained 0.64%. Artificial intelligence and solid corporate earnings drove some exuberance in the market and boosted investor confidence in the week. Speculation swirled around the Bank of Japan’s (BoJ’s) probable monetary policy trajectory. There are signs that the central bank is moving closer to raising short-term interest rates out of negative territory, about which policymakers appear to be gaining greater conviction than previously thought. A BoJ board member suggested that a virtuous cycle of prices rising in tandem with wages (a stated precondition for monetary policy tightening) was in sight. Against this development, the yield on the 10-year Japanese government bond rose to 0.73% from 0.71% at the end of the previous week. The strength of the yen weighs on Japan’s exporters as they realize significant dollar-denominated revenues. Over the past three years, Japanese stock markets have significantly gained on the back of the currency’s weakness.
Chinese stocks gained this week resulting from the government’s recent market stabilization measures. Despite an uncertain economic outlook, investor confidence was significantly lifted by the roll-out of the measures. The Shanghai Composite Index climbed by 0.63% while the blue-chip CSI 300 added 0.2%. The Hong Kong benchmark Hang Seng Index pulled back by 1.42%. At the National People’s Congress (NPC), China’s parliament which started on March 5 and will end March 11, Beijing set an economic growth target of around 5% for 2024. This target is the same as last year’s target when China’s economy officially rose by 5.2%. Analysts have expressed skepticism, however, that the country would find it difficult to match this growth rate, which benefitted from a post-lockdown rebound in early 2023. Beijing set the budget deficit at about the same target as last year, which was initially at 3% before it was subsequently raised to 3.8% to accommodate more borrowing. The government said that it would issue RMB 1 trillion in special ultra-long central government bonds to further support economic growth.
The Week
CPI and PPI inflation data for February and retail sales data are a few of the important economic data scheduled for release in the coming week.
Key Topics to Watch
- NFIB optimism index for February
- Consumer price index (CPI) for February
- Core CPI for February
- CPI year-over-year
- Core CPI year-over-year
- Monthly U.S. federal budget for February
- U.S. retail sales for February
- Retail sales minus autos for February
- Producer price index (PPI) for February
- Core PPI for February
- PPI year-over-year
- Core PPI year-over-year
- Initial jobless claims for March 8
- Business inventories off January
- Empire State manufacturing survey for March
- Import price index for February
- Import price index minus fuel for February
- Industrial production for February
- Capacity utilization for February
- Consumer sentiment (prelim) for March
Markets Index Wrap-Up