Archives for March 27, 2020

Money expert Ramit Sethi shares his 3-step strategy to save money while eliminating debt

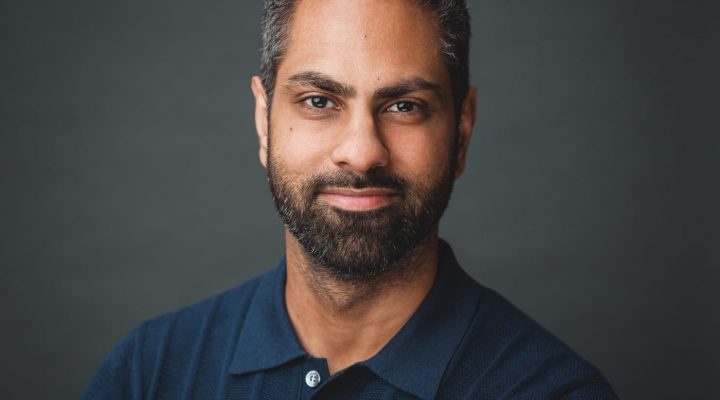
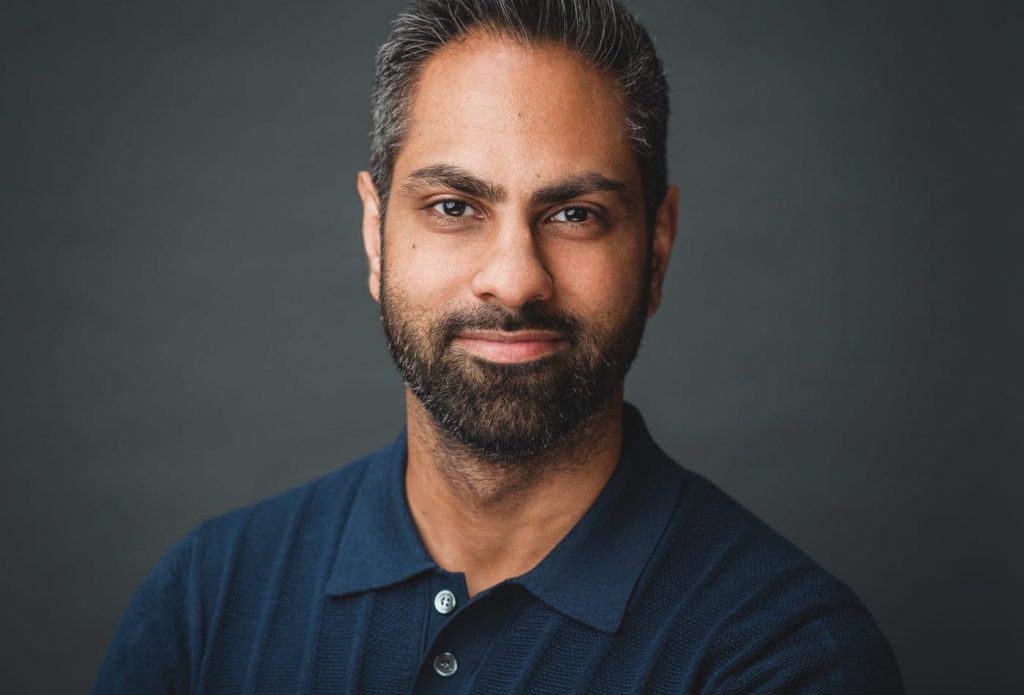
On Wednesday, Ramit Sethi, personal finance coach and best-selling author of “I Will Teach You to be Rich,” took over the CNBC Make It Instagram page to answer reader questions and offer financial advice.

During the live Q&A session, Sethi fielded questions from CNBC Make It Instagram followers on everything from how to earn more to how to start a business to how to save money while eliminating debt.

If you missed Sethi’s live stream, here’s a recap of his best advice. Answers have been lightly edited for length and clarity.

Is it safe to purchase a house right now?

Sethi: Cash is king and you do not want to tie up a ton of cash in an expense without knowing what’s going to happen.

What is the best book to learn about investing?

Sethi: “I Will Teach You to be Rich,” of course! Pick up the book. You’ll learn everything you need to know about money.

What’s the No. 1 thing you wish you would have done in your 20s but didn’t?

Sethi: Be spontaneous! It’s good to have plans … but sometimes you have to do something that feels good without knowing where it may lead.

I got $10,000 from my tax refund, a college student says. What should I do with the money?

Sethi: This is a good time to put that toward a one-year emergency fund. We don’t know what’s going to happen. Yes, you have a long time horizon and for someone who’s young, you have major opportunities in the future with investing. But right now, cash in your pocket is more important than potential cash down the road. Save it and you can start investing slowly over the long term.

What’s the best way to be productive while in quarantine?

Sethi: When you fast forward, whether it’s two months, three months, six months, I want you to be able to look back and say, What did I make of this time? In the early days right now, a lot of it is just about survival. How do we get things set up? Are we equipped on food? Do we feel safe? We need to do that stuff first. But after that, we want to look back and say, Did I make an opportunity of this? What skills did I learn? I’ve always said if I had more time, I would pick up another language. This is that chance.

My recommendation is to put 30 minutes in your calendar each day for that long-term goal that you’ve always wanted to do. Is it to learn a language? Is it to plan out a trip that you are going to take in the future? Whatever it is, create an opportunity so that once this is over and we go back to our new normal, we can look back and say, I’m proud of myself for what I accomplished.

What is the best way to save while also paying off student loans and credit card debt?

Sethi: There are three parts here: C.E.O. The first is cut costs. The second is earn more. And the third is optimize your spending. Let’s go through them.

To cut costs is one you are familiar with. You should cut costs and you should have somebody else look at your expenses. They’ll quickly be able to tell you 10% to 15% more that you could cut.

The second and more important part is ‘E,’ [which stands for] ‘earn more.’ See, there’s a limit to how much you can cut, but there’s no limit to how much you can earn. Whether it is negotiating your salary when things get back to a new normal or whether it is starting a business right now so you can increase your earnings, that’s powerful.

The final point is ‘O,’ [which stands for] ‘optimize your spending.’ Call up your credit card companies … call up your student loan companies and ask them to work with you. Make sure they levy no finance or interest charges.

What are the best and worst pieces of financial advice you’ve heard?

Sethi: Let’s start with the worst: Cut back on lattes! Guys, saving $3 a day is not going to change your financial life in a material way. It’s all focused around no. No, you can’t buy lattes. No, you can’t go out. No, you can’t buy jeans. You can’t do anything! Maybe, if you save for the next 80 years, maybe then, you’ll be able to come out of that cave and live life. I hate that. I want to live a rich life where money is about saying ‘yes.’

My best advice is to do the fundamentals. Automate your savings and investments and remember a rich life is lived outside the spreadsheet. That means travel, that means relationships, that means feeling safe enough to take risks.

How do you start a business if you are not sure which idea will sell?

Sethi: A simple way to do it is to ask your friends, Right now, what is something that you come to me for advice on? So you’re known as the person who’s really good at keeping your apartment organized or who’s really good at relationship advice. Write those answers down and ask 10 people. You’ll be surprised by the end of the day how much you’re really good at that you never even thought of.

OnePlus 8 Pro will reportedly include wireless charging and waterproofing

It may also come in a lovely seafoam green-like color.

Despite their value proposition, OnePlus phones have long had two significant flaws: to date, they’ve never included an official water-resistance rating or support for wireless charging. As the cost of the company’s devices has increased with each subsequent release, that’s something that has started to irk people. But it looks like OnePlus will finally address those issues. Unfortunately, you may need to buy the company’s most expensive device to get those features.

On Twitter, leaker Ishan Agarwal shared spec sheets detailing most of the features and internals of the OnePlus 8 and OnePlus 8 Pro. The interesting bit of information here is that reportedly only the Pro model will include wireless charging and an IP68 water-resistance rating. Agarwal claims the OnePlus 8 Pro will support 30W wireless fast charging. When asked about inductive charging in the past, OnePlus CEO Pete Lau has consistently said the company didn’t want to include the feature until it could make it as fast as its wired power adapter, which it appears it has been able to do. Taking a page from Samsung’s bag of tricks, the phone will also be able to inductively charge other Qi-compatible devices you place on its back.

As expected, the higher-end variant will also feature a 120Hz refresh panel, instead of a 90Hz one. It will also include faster LPDDR5 RAM, a quad-camera array with two 48-megapixel sensors and a sizeable 4,510mAh battery.

OP8 Pro Green

Other than the addition of a Snapdragon 865 processor, a slightly bigger battery and a 12GB RAM option, it doesn’t look like the more affordable OnePlus 8 will be a significant upgrade over the 7T. Looking at the camera specs, the 8 may also feature a less versatile camera than its predecessor. It seems OnePlus plans to trade out either the 7T’s telephoto or ultrawide camera for a 2-megapixel depth sensor.

In a separate leak, Slashleaks co-owner Steve Hemmerstoffer shared what he claims are official renders of the OnePlus 8 Pro in a lovely seafoam green-like color. None of the leaked specs are a surprise at this point, but they give us our best idea yet of what we can expect from OnePlus’ latest phones. We’ll likely learn more about the handsets as OnePlus slowly drip feeds more information about them ahead of their eventual release.

YouTube Music’s redesigned playback screen includes lyrics

It’s also much easier to shuffle or repeat tracks.

YouTube Music is still catching up on features, and this time around it’s one of the most important elements: the Now Playing screen you see whenever you listen. After weeks of testing, the Android version’s updated playback screen includes clearer and more persistent buttons, including Up Next (to show your queue), shuffle, repeat and flipping between pure music and videos. However, it also includes an “experiment” that displays lyrics — not a new feature in music apps, but appreciated all the same. Just be aware that it only works with some songs.

The updated screen is available in the latest version of YouTube Music’s Android app today, although it may take a few days to roll out to everyone. You should also expect a corresponding update for iOS sometime in the “near future.” While this won’t convince you to switch to YouTube Music (even if you’re a Google Play Music user), it might convince you to stay if earlier design decisions proved frustrating.

Capri Holdings Limited (CPRI) and PPL Corporation (PPL)

COLUMBIA MANAGEMENT INVESTMENT A bought a fresh place in Capri Holdings Limited (NYSE:CPRI). The institutional investor bought 1.9 million shares of the stock in a transaction took place on 12/31/2019. In another most recent transaction, which held on 12/31/2019, RUSSELL INVESTMENT MANAGEMENT LL bought approximately 1.8 million shares of Capri Holdings Limited In a separate transaction which took place on 12/31/2019, the institutional investor, ANTIPODES PARTNERS LTD. bought 1.2 million shares of the company’s stock. The total Institutional investors and hedge funds own 98.30% of the company’s stock.

In the most recent purchasing and selling session, Capri Holdings Limited (CPRI)’s share price increased by 16.02 percent to ratify at $12.89. A sum of 6651716 shares traded at recent session and its average exchanging volume remained at 3.81M shares. The 52-week price high and low points are important variables to concentrate on when assessing the current and prospective worth of a stock. Capri Holdings Limited (CPRI) shares are taking a pay cut of -74.22% from the high point of 52 weeks and flying high of 137.82% from the low figure of 52 weeks.

Capri Holdings Limited (CPRI) shares reached a high of $13.52 and dropped to a low of $10.84 until finishing in the latest session at $11.97. Traders and investors may also choose to study the ATR or Average True Range when concentrating on technical inventory assessment. Currently at 2.24 is the 14-day ATR for Capri Holdings Limited (CPRI). The highest level of 52-weeks price has $50.00 and $5.42 for 52 weeks lowest level. After the recent changes in the price, the firm captured the enterprise value of $5.7B, with the price to earnings ratio of 5.65 and price to earnings growth ratio of 4.28. The liquidity ratios which the firm has won as a quick ratio of 0.40, a current ratio of 0.80 and a debt-to-equity ratio of 0.81.

Having a look at past record, we’re going to look at various forwards or backwards shifting developments regarding CPRI. The firm’s shares rose 71.41 percent in the past five business days and shrunk -49.75 percent in the past thirty business days. In the previous quarter, the stock fell -66.01 percent at some point. The output of the stock decreased -60.58 percent within the six-month closing period, while general annual output lost -70.95 percent. The company’s performance is now negative at -66.21% from the beginning of the calendar year.

According to WSJ, Capri Holdings Limited (CPRI) obtained an estimated Overweight proposal from the 25 brokerage firms currently keeping a deep eye on the stock performance as compares to its rivals. 0 equity research analysts rated the shares with a selling strategy, 15 gave a hold approach, 10 gave a purchase tip, 0 gave the firm a overweight advice and 0 put the stock under the underweight category. The average price goal of one year between several banks and credit unions that last year discussed the stock is $35.95.

PPL Corporation (PPL) shares on Wednesday’s trading session, jumped 4.66 percent to see the stock exchange hands at $22.23 per unit. Lets a quick look at company’s past reported and future predictions of growth using the EPS Growth. EPS growth is a percentage change in standardized earnings per share over the trailing-twelve-month period to the current year-end. The company posted a value of $2.37 as earning-per-share over the last full year, while a chance, will post $2.50 for the coming year. The current EPS Growth rate for the company during the year is -8.00% and predicted to reach at -0.04% for the coming year. In-depth, if we analyze for the long-term EPS Growth, the out-come was 1.90% for the past five years and the scenario is totally different as the current prediction is 0.50% for the next five year.

The last trading period has seen PPL Corporation (PPL) move -39.64% and 22.68% from the stock’s 52-week high and 52-week low prices respectively. The daily trading volume for PPL Corporation (NYSE:PPL) over the last session is 8.43 million shares. PPL has attracted considerable attention from traders and investors, a scenario that has seen its volume jump 36.62% compared to the previous one.

Investors focus on the profitability proportions of the company that how the company performs at profitability side. Return on equity ratio or ROE is a significant indicator for prospective investors as they would like to see just how effectively a business is using their cash to produce net earnings. As a return on equity, PPL Corporation (NYSE:PPL) produces 14.20%. Because it would be easy and highly flexible, ROI measurement is among the most popular investment ratios. Executives could use it to evaluate the levels of performance on acquisitions of capital equipment whereas investors can determine that how the stock investment is better. The ROI entry for PPL’s scenario is at 6.70%. Another main metric of a profitability ratio is the return on assets ratio or ROA that analyses how effectively a business can handle its assets to generate earnings over a duration of time. PPL Corporation (PPL) generated 3.90% ROA for the trading twelve-month.

Volatility is just a proportion of the anticipated day by day value extend—the range where an informal investor works. Greater instability implies more noteworthy benefit or misfortune. After an ongoing check, PPL Corporation (PPL) stock is found to be 11.86% volatile for the week, while 7.90% volatility is recorded for the month. The outstanding shares have been calculated 811.20M. Based on a recent bid, its distance from 20 days simple moving average is -18.84%, and its distance from 50 days simple moving average is -31.69% while it has a distance of -30.77% from the 200 days simple moving average.

The Williams Percent Range or Williams %R is a well-known specialized pointer made by Larry Williams to help recognize overbought and oversold circumstances. PPL Corporation (NYSE:PPL)’s Williams Percent Range or Williams %R at the time of writing to be seated at 58.90% for 9-Day. It is also calculated for different time spans. Currently for this organization, Williams %R is stood at 69.76% for 14-Day, 72.65% for 20-Day, 78.03% for 50-Day and to be seated 78.03% for 100-Day. Relative Strength Index, or RSI(14), which is a technical analysis gauge, also used to measure momentum on a scale of zero to 100 for overbought and oversold. In the case of PPL Corporation, the RSI reading has hit 35.02 for 14-Day.

Funko Inc. (FNKO) and Bancolombia S.A. (CIB)

WOODSON CAPITAL MANAGEMENT LP bought a fresh place in Funko Inc. (NASDAQ:FNKO). The institutional investor bought 701.2 thousand shares of the stock in a transaction took place on 1/31/2020. In another most recent transaction, which held on 12/31/2019, NUVEEN ASSET MANAGEMENT LLC bought approximately 536.5 thousand shares of Funko Inc. In a separate transaction which took place on 12/31/2019, the institutional investor, MASSACHUSETTS FINANCIAL SERVICES bought 479.3 thousand shares of the company’s stock. The total Institutional investors and hedge funds own 91.50% of the company’s stock.

In the most recent purchasing and selling session, Funko Inc. (FNKO)’s share price increased by 9.89 percent to ratify at $4.00. A sum of 1073821 shares traded at recent session and its average exchanging volume remained at 1.14M shares. The 52-week price high and low points are important variables to concentrate on when assessing the current and prospective worth of a stock. Funko Inc. (FNKO) shares are taking a pay cut of -85.66% from the high point of 52 weeks and flying high of 13.31% from the low figure of 52 weeks.

Funko Inc. (FNKO) shares reached a high of $4.10 and dropped to a low of $3.79 until finishing in the latest session at $3.90. Traders and investors may also choose to study the ATR or Average True Range when concentrating on technical inventory assessment. Currently at 0.63 is the 14-day ATR for Funko Inc. (FNKO). The highest level of 52-weeks price has $27.89 and $3.53 for 52 weeks lowest level. After the recent changes in the price, the firm captured the enterprise value of $496.96M, with the price to earnings ratio of 11.14 and price to earnings growth ratio of 6.19. The liquidity ratios which the firm has won as a quick ratio of 1.30, a current ratio of 1.60 and a debt-to-equity ratio of 1.07.

Having a look at past record, we’re going to look at various forwards or backwards shifting developments regarding FNKO. The firm’s shares fell -11.50 percent in the past five business days and shrunk -53.08 percent in the past thirty business days. In the previous quarter, the stock fell -75.20 percent at some point. The output of the stock decreased -81.19 percent within the six-month closing period, while general annual output lost -80.98 percent. The company’s performance is now negative at -76.69% from the beginning of the calendar year.

According to WSJ, Funko Inc. (FNKO) obtained an estimated Hold proposal from the 9 brokerage firms currently keeping a deep eye on the stock performance as compares to its rivals. 1 equity research analysts rated the shares with a selling strategy, 5 gave a hold approach, 2 gave a purchase tip, 0 gave the firm a overweight advice and 1 put the stock under the underweight category. The average price goal of one year between several banks and credit unions that last year discussed the stock is $8.53.

Bancolombia S.A. (CIB) shares on Tuesday’s trading session, jumped 4.47 percent to see the stock exchange hands at $17.31 per unit. Lets a quick look at company’s past reported and future predictions of growth using the EPS Growth. EPS growth is a percentage change in standardized earnings per share over the trailing-twelve-month period to the current year-end. The company posted a value of $3.65 as earning-per-share over the last full year, while a chance, will post $4.99 for the coming year. The current EPS Growth rate for the company during the year is 1.70% and predicted to reach at 10.30% for the coming year. In-depth, if we analyze for the long-term EPS Growth, the out-come was 20.00% for the past five years and the scenario is totally different as the current prediction is 17.30% for the next five year.

The last trading period has seen Bancolombia S.A. (CIB) move -69.14% and 6.39% from the stock’s 52-week high and 52-week low prices respectively. The daily trading volume for Bancolombia S.A. (NYSE:CIB) over the last session is 1.44 million shares. CIB has attracted considerable attention from traders and investors, a scenario that has seen its volume jump 210.03% compared to the previous one.

Investors focus on the profitability proportions of the company that how the company performs at profitability side. Return on equity ratio or ROE is a significant indicator for prospective investors as they would like to see just how effectively a business is using their cash to produce net earnings. As a return on equity, Bancolombia S.A. (NYSE:CIB) produces 14.40%. Because it would be easy and highly flexible, ROI measurement is among the most popular investment ratios. Executives could use it to evaluate the levels of performance on acquisitions of capital equipment whereas investors can determine that how the stock investment is better. The ROI entry for CIB’s scenario is at 9.00%. Another main metric of a profitability ratio is the return on assets ratio or ROA that analyses how effectively a business can handle its assets to generate earnings over a duration of time. Bancolombia S.A. (CIB) generated 1.60% ROA for the trading twelve-month.

Volatility is just a proportion of the anticipated day by day value extend—the range where an informal investor works. Greater instability implies more noteworthy benefit or misfortune. After an ongoing check, Bancolombia S.A. (CIB) stock is found to be 14.85% volatile for the week, while 9.33% volatility is recorded for the month. The outstanding shares have been calculated 259.11M. Based on a recent bid, its distance from 20 days simple moving average is -50.82%, and its distance from 50 days simple moving average is -62.74% while it has a distance of -65.35% from the 200 days simple moving average.

The Williams Percent Range or Williams %R is a well-known specialized pointer made by Larry Williams to help recognize overbought and oversold circumstances. Bancolombia S.A. (NYSE:CIB)’s Williams Percent Range or Williams %R at the time of writing to be seated at 93.28% for 9-Day. It is also calculated for different time spans. Currently for this organization, Williams %R is stood at 96.44% for 14-Day, 96.90% for 20-Day, 97.35% for 50-Day and to be seated 97.39% for 100-Day. Relative Strength Index, or RSI(14), which is a technical analysis gauge, also used to measure momentum on a scale of zero to 100 for overbought and oversold. In the case of Bancolombia S.A., the RSI reading has hit 14.98 for 14-Day.

UP Fintech Holding Limited (TIGR) and Devon Energy Corporation (DVN)

MORGAN STANLEY & CO. LLC bought a fresh place in UP Fintech Holding Limited (NASDAQ:TIGR). The institutional investor bought 181.2 thousand shares of the stock in a transaction took place on 12/31/2019. In another most recent transaction, which held on 12/31/2019, D. E. SHAW & CO. LP bought approximately 38.5 thousand shares of UP Fintech Holding Limited In a separate transaction which took place on 12/31/2019, the institutional investor, CITADEL ADVISORS LLC bought 34.7 thousand shares of the company’s stock. The total Institutional investors and hedge funds own 0.50% of the company’s stock.

In the most recent purchasing and selling session, UP Fintech Holding Limited (TIGR)’s share price increased by 4.17 percent to ratify at $2.75. A sum of 1855306 shares traded at recent session and its average exchanging volume remained at 541.85K shares. The 52-week price high and low points are important variables to concentrate on when assessing the current and prospective worth of a stock. UP Fintech Holding Limited (TIGR) shares are taking a pay cut of -88.49% from the high point of 52 weeks and flying high of 35.47% from the low figure of 52 weeks.

UP Fintech Holding Limited (TIGR) shares reached a high of $3.18 and dropped to a low of $2.64 until finishing in the latest session at $3.11. Traders and investors may also choose to study the ATR or Average True Range when concentrating on technical inventory assessment. Currently at 0.27 is the 14-day ATR for UP Fintech Holding Limited (TIGR). The highest level of 52-weeks price has $23.89 and $2.03 for 52 weeks lowest level. After the recent changes in the price, the firm captured the enterprise value of $327.22M. The liquidity ratios which the firm has won as a quick ratio of 1.70, a current ratio of 1.70 and a debt-to-equity ratio of 0.00.

Having a look at past record, we’re going to look at various forwards or backwards shifting developments regarding TIGR. The firm’s shares rose 25.00 percent in the past five business days and shrunk -25.47 percent in the past thirty business days. In the previous quarter, the stock fell -24.03 percent at some point. The output of the stock decreased -38.89 percent within the six-month closing period, while general annual output lost -77.18 percent. The company’s performance is now negative at -22.54% from the beginning of the calendar year.

According to WSJ, UP Fintech Holding Limited (TIGR) obtained an estimated Hold proposal from the 1 brokerage firms currently keeping a deep eye on the stock performance as compares to its rivals. 0 equity research analysts rated the shares with a selling strategy, 1 gave a hold approach, 0 gave a purchase tip, 0 gave the firm a overweight advice and 0 put the stock under the underweight category. The average price goal of one year between several banks and credit unions that last year discussed the stock is $5.80.

Devon Energy Corporation (DVN) shares on Wednesday’s trading session, dropped -3.37 percent to see the stock exchange hands at $7.16 per unit. Lets a quick look at company’s past reported and future predictions of growth using the EPS Growth. EPS growth is a percentage change in standardized earnings per share over the trailing-twelve-month period to the current year-end. The company posted a value of -$0.19 as earning-per-share over the last full year, while a chance, will post $0.32 for the coming year. The current EPS Growth rate for the company during the year is -118.70% and predicted to reach at 366.70% for the coming year. In-depth, if we analyze for the long-term EPS Growth, the out-come was -15.50% for the past five years and the scenario is totally different as the current prediction is 25.50% for the next five year.

The last trading period has seen Devon Energy Corporation (DVN) move -79.77% and 52.34% from the stock’s 52-week high and 52-week low prices respectively. The daily trading volume for Devon Energy Corporation (NYSE:DVN) over the last session is 12.02 million shares. DVN has attracted considerable attention from traders and investors, a scenario that has seen its volume jump 35.35% compared to the previous one.

Investors focus on the profitability proportions of the company that how the company performs at profitability side. Return on equity ratio or ROE is a significant indicator for prospective investors as they would like to see just how effectively a business is using their cash to produce net earnings. As a return on equity, Devon Energy Corporation (NYSE:DVN) produces -5.30%. Because it would be easy and highly flexible, ROI measurement is among the most popular investment ratios. Executives could use it to evaluate the levels of performance on acquisitions of capital equipment whereas investors can determine that how the stock investment is better. The ROI entry for DVN’s scenario is at 1.70%. Another main metric of a profitability ratio is the return on assets ratio or ROA that analyses how effectively a business can handle its assets to generate earnings over a duration of time. Devon Energy Corporation (DVN) generated -2.30% ROA for the trading twelve-month.

Volatility is just a proportion of the anticipated day by day value extend—the range where an informal investor works. Greater instability implies more noteworthy benefit or misfortune. After an ongoing check, Devon Energy Corporation (DVN) stock is found to be 20.16% volatile for the week, while 16.13% volatility is recorded for the month. The outstanding shares have been calculated 316.26M. Based on a recent bid, its distance from 20 days simple moving average is -33.00%, and its distance from 50 days simple moving average is -60.46% while it has a distance of -68.43% from the 200 days simple moving average.

The Williams Percent Range or Williams %R is a well-known specialized pointer made by Larry Williams to help recognize overbought and oversold circumstances. Devon Energy Corporation (NYSE:DVN)’s Williams Percent Range or Williams %R at the time of writing to be seated at 38.65% for 9-Day. It is also calculated for different time spans. Currently for this organization, Williams %R is stood at 76.62% for 14-Day, 79.69% for 20-Day, 88.96% for 50-Day and to be seated 88.96% for 100-Day. Relative Strength Index, or RSI(14), which is a technical analysis gauge, also used to measure momentum on a scale of zero to 100 for overbought and oversold. In the case of Devon Energy Corporation, the RSI reading has hit 31.13 for 14-Day.