Archives for March 1, 2020

Moment stops work on its Android camera app due to complexity

It says there are too many Android variants to support them all properly.

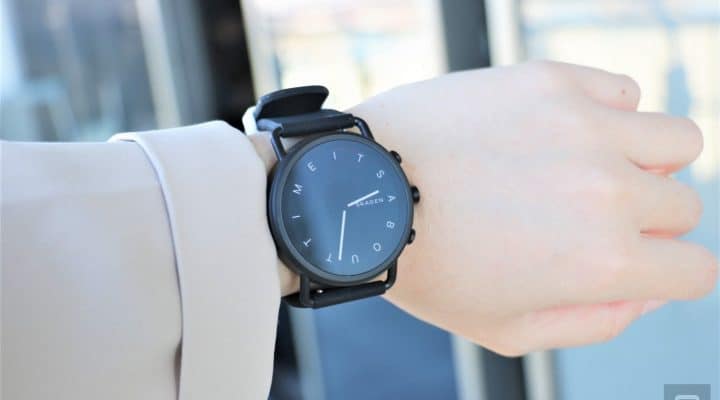
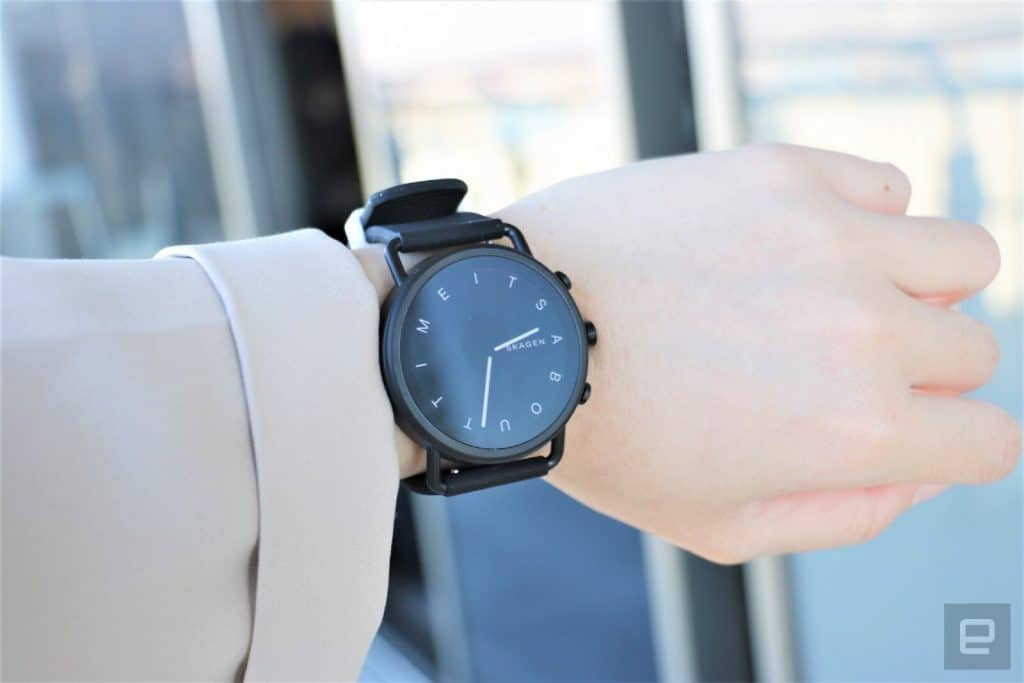
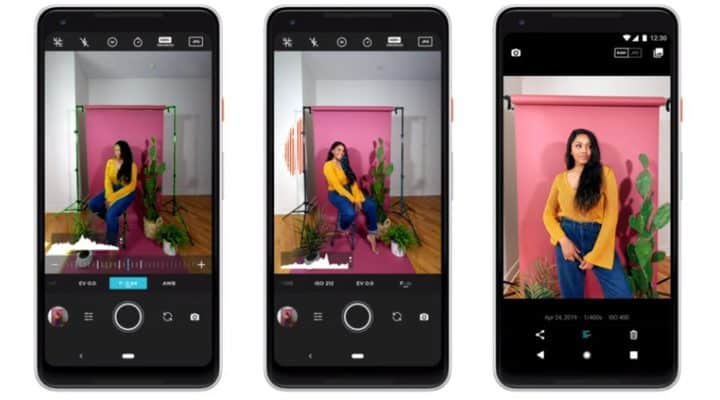
You may have to be pickier about your choice of phone if you’re a mobile photography enthusiast. Moment has stopped working on its Pro Camera app for Android due to a lack of “engineering bandwidth” (read: enough available staff) to develop the software properly. Simply put, it comes down to the complexity of the Android ecosystem. Phone makers frequently create custom Android versions with different levels of access to “select camera features,” Moment said, leading to wildly varying feature compatibility lists — and that’s before accounting for OS updates that break these manufacturer changes.

The app will live on in Google Play for those who want to use it, but it won’t receive updates. The developer is steering people to Filmic Pro if they want a dedicated Android app. Work on iOS, meanwhile, will continue unabated. Apple’s software is “more robust” and allows work on the new features people want, according to Moment.

The company is butting up against one of Android’s greatest strengths and weaknesses. While its openness to phone makers allows for extensive variety and customization among Android hardware, it also forces developers to support a wide array of devices if they want to reach the largest possible audience. That may lead them to develop for the lowest common denominator or chew up extensive resources for testing.

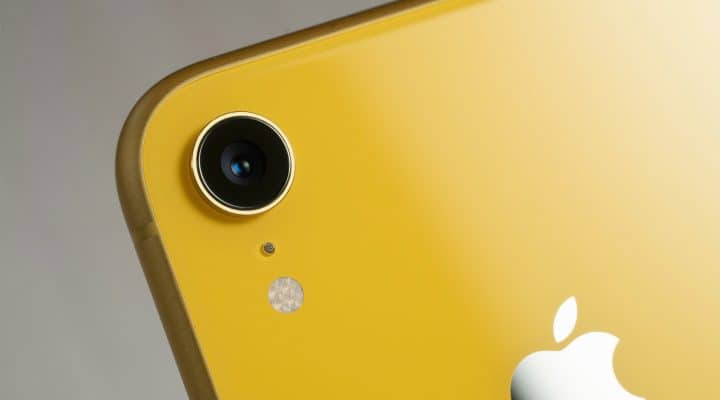
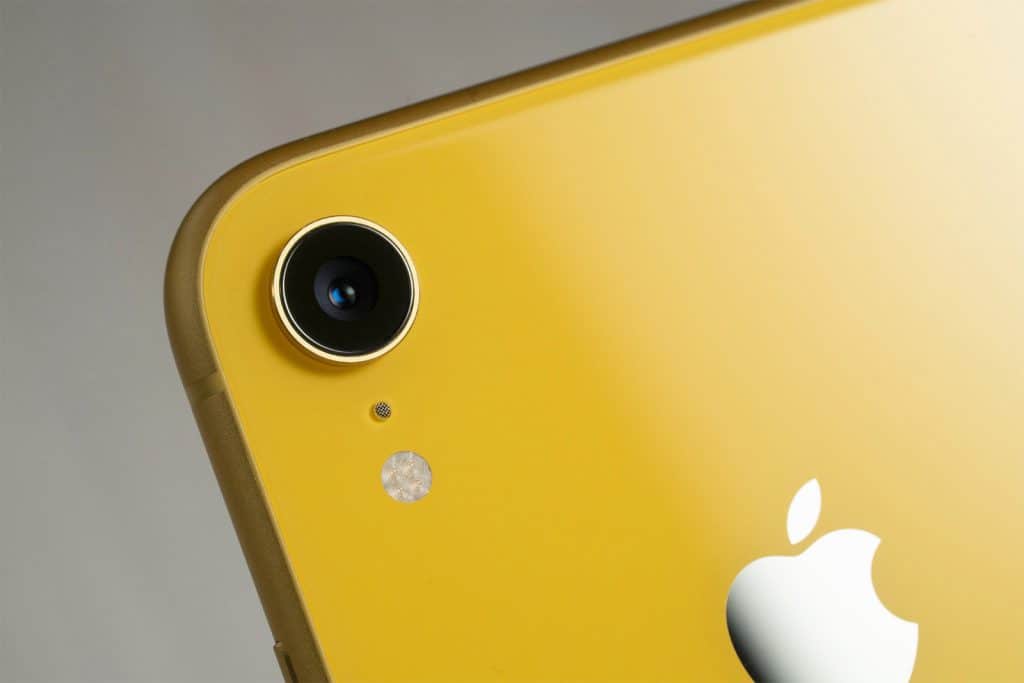
There’s also the question of whether these apps are as necessary as they once were. Phones like the Galaxy S20 family have pro modes in their camera apps that provide many of the manual controls you might want. Even if there isn’t a one-for-one match between those apps and what companies like Moment have to offer, the default apps may be good enough in most shooting situations.

Google survey hints at big plans for Wear OS health tracking

It might catch up to Apple, Samsung and Fitbit.

Wear OS is struggling, in no small part due to its so-so health features — there’s a good reason Google bought Fitbit. However, Google has hinted that it intends to catch up. Droid Life has learned that an ongoing User Experience Research survey that asks participants how they would fix Wear OS, and there’s a strong emphasis on adding health features — many of them crucial features.

Some of them will sound familiar if you’ve seen rival watches. Google asked users about automatc workout detection, irregular heartbeat alerts (much like you get on an Apple Watch), breathing exercises, reproductive cycle tracking and extensive sleep tracking features that include apnea detection and smart alarms. It also wanted to know if users are interested in pairing with gym equipment and medical devices. Others are less common, though, such as SPO2 (blood oxygenation) tracking, indoor air quality data and “micro-logging” your activity.

There’s no guarantee Google will implement any new features, let alone all of them. That’s almost beside the point, though. This is really an indication that Google intends to compete more aggressively with Apple, Samsung and others with health-oriented smartwatches, and Fitbit’s know-how could help it get there.

Nearly every top-selling smartphone in 2019 was an iPhone or Galaxy

Few other phone makers got much traction outside of China.

It’s almost a cliché to say that Apple and Samsung dictate the tempo of the smartphone market, but there’s now more evidence to support that claim. Counterpoint Research has calculated that nine out of the top ten smartphones sold worldwide in 2019 were made by either Apple or Samsung — Oppo’s A5 was the only exception at fifth place. The iPhone XR had the clear lead, representing 3 percent of all phones sold, while the Galaxy A50 was the top Android phone on the list with 1.8 percent.

Just where these phones dominated is another matter. It won’t surprise you to hear that Apple ruled North America, taking all of the top five slots, and took two of the top spots in Europe. In most other places, though, it’s a Samsung planet. Samsung had the most top-five phones in Europe, Latin America, MEA (Middle East and Africa) and most of the Asia-Pacific area. The only place where Apple and Samsung failed to place was, unsurprisingly, China. Oppo, Vivo and Huawei led the pack in their home country.

While this does line up with market share estimates, it doesn’t completely reflect the market. Companies like Huawei and BBK (which owns Oppo, Vivo, Realme and OnePlus) often fare well, but their phone sales tend to be distributed across many models rather than a handful of favorites. Still, this showed the lack of variety in the market, and Counterpoint warned that there appeared to be “consolidation” where fewer and fewer phone makers enjoyed success. That’s a problem if you’re eager for phone choices, especially if you live in a place where one brand reigns supreme.

Top 10 phones of 2019 by sales according to Counterpoint

Zogenix Inc. (ZGNX) and NovoCure Limited (NVCR)

T. ROWE PRICE ASSOCIATES, INC. ( bought a fresh place in Zogenix Inc. (NASDAQ:ZGNX). The institutional investor bought 808.2 thousand shares of the stock in a transaction took place on 12/31/2019. In another most recent transaction, which held on 12/31/2019, JANUS CAPITAL MANAGEMENT LLC bought approximately 490.8 thousand shares of Zogenix Inc. In a separate transaction which took place on 12/31/2019, the institutional investor, HEALTHCOR MANAGEMENT LP bought 487.6 thousand shares of the company’s stock.

In the most recent purchasing and selling session, Zogenix Inc. (ZGNX)’s share price decreased by -6.93 percent to ratify at $26.06. A sum of 1546389 shares traded at recent session and its average exchanging volume remained at 858.86K shares. The 52-week price high and low points are important variables to concentrate on when assessing the current and prospective worth of a stock. Zogenix Inc. (ZGNX) shares are taking a pay cut of -54.46% from the high point of 52 weeks and flying high of -6.86% from the low figure of 52 weeks.

Traders and investors may also choose to study the ATR or Average True Range when concentrating on technical inventory assessment. Currently at 2.36 is the 14-day ATR for Zogenix Inc. (ZGNX). The highest level of 52-weeks price has $57.22 and $27.98 for 52 weeks lowest level. After the recent changes in the price, the firm captured the enterprise value of $996.7M. The liquidity ratios which the firm has won as a quick ratio of 3.00, a current ratio of 3.00 and a debt-to-equity ratio of 0.00.

Having a look at past record, we’re going to look at various forwards or backwards shifting developments regarding ZGNX. The firm’s shares fell -14.39 percent in the past five business days and shrunk -47.28 percent in the past thirty business days. In the previous quarter, the stock fell -44.54 percent at some point. The output of the stock decreased -43.09 percent within the six-month closing period, while general annual output lost -47.37 percent. The company’s performance is now negative at -50.01% from the beginning of the calendar year.

NovoCure Limited (NVCR) shares on Wednesday’s trading session, dropped -0.72 percent to see the stock exchange hands at $79.45 per unit. Lets a quick look at company’s past reported and future predictions of growth using the EPS Growth. EPS growth is a percentage change in standardized earnings per share over the trailing-twelve-month period to the current year-end. The company posted a value of -$0.29 as earning-per-share over the last full year, while a chance, will post $0.40 for the coming year. The current EPS Growth rate for the company during the year is 36.50% and predicted to reach at 500.00% for the coming year. In-depth, if we analyze for the long-term EPS Growth, the out-come was 5.90% for the past five years.

The last trading period has seen NovoCure Limited (NVCR) move -19.62% and 91.40% from the stock’s 52-week high and 52-week low prices respectively. The daily trading volume for NovoCure Limited (NASDAQ:NVCR) over the last session is 1.1 million shares. NVCR has attracted considerable attention from traders and investors, a scenario that has seen its volume jump 29.32% compared to the previous one.

Investors focus on the profitability proportions of the company that how the company performs at profitability side. Return on equity ratio or ROE is a significant indicator for prospective investors as they would like to see just how effectively a business is using their cash to produce net earnings. As a return on equity, NovoCure Limited (NASDAQ:NVCR) produces -18.50%. Because it would be easy and highly flexible, ROI measurement is among the most popular investment ratios. Executives could use it to evaluate the levels of performance on acquisitions of capital equipment whereas investors can determine that how the stock investment is better. The ROI entry for NVCR’s scenario is at -19.60%. Another main metric of a profitability ratio is the return on assets ratio or ROA that analyses how effectively a business can handle its assets to generate earnings over a duration of time. NovoCure Limited (NVCR) generated -7.00% ROA for the trading twelve-month.

Volatility is just a proportion of the anticipated day by day value extend—the range where an informal investor works. Greater instability implies more noteworthy benefit or misfortune. After an ongoing check, NovoCure Limited (NVCR) stock is found to be 5.12% volatile for the week, while 3.68% volatility is recorded for the month. The outstanding shares have been calculated 104.22M. Based on a recent bid, its distance from 20 days simple moving average is -9.89%, and its distance from 50 days simple moving average is -7.75% while it has a distance of 3.18% from the 200 days simple moving average.

The Williams Percent Range or Williams %R is a well-known specialized pointer made by Larry Williams to help recognize overbought and oversold circumstances. NovoCure Limited (NASDAQ:NVCR)’s Williams Percent Range or Williams %R at the time of writing to be seated at 89.43% for 9-Day. It is also calculated for different time spans. Currently for this organization, Williams %R is stood at 89.43% for 14-Day, 89.43% for 20-Day, 74.75% for 50-Day and to be seated 62.61% for 100-Day. Relative Strength Index, or RSI(14), which is a technical analysis gauge, also used to measure momentum on a scale of zero to 100 for overbought and oversold. In the case of NovoCure Limited, the RSI reading has hit 35.07 for 14-Day.

Peabody Energy Corporation (BTU) and Top Ships Inc. (TOPS)

T. ROWE PRICE ASSOCIATES, INC. ( bought a fresh place in Peabody Energy Corporation (NYSE:BTU). The institutional investor bought 5.2 million shares of the stock in a transaction took place on 12/31/2019. In another most recent transaction, which held on 12/31/2019, SSGA FUNDS MANAGEMENT, INC. bought approximately 1.4 million shares of Peabody Energy Corporation In a separate transaction which took place on 12/31/2019, the institutional investor, MELLON INVESTMENTS CORP. bought 871.3 thousand shares of the company’s stock. The total Institutional investors and hedge funds own 3.50% of the company’s stock.

In the most recent purchasing and selling session, Peabody Energy Corporation (BTU)’s share price decreased by -14.73 percent to ratify at $5.50. A sum of 2420139 shares traded at recent session and its average exchanging volume remained at 2.12M shares. The 52-week price high and low points are important variables to concentrate on when assessing the current and prospective worth of a stock. Peabody Energy Corporation (BTU) shares are taking a pay cut of -81.99% from the high point of 52 weeks and flying high of -11.08% from the low figure of 52 weeks.

Traders and investors may also choose to study the ATR or Average True Range when concentrating on technical inventory assessment. Currently at 0.63 is the 14-day ATR for Peabody Energy Corporation (BTU). The highest level of 52-weeks price has $30.54 and $6.18 for 52 weeks lowest level. After the recent changes in the price, the firm captured the enterprise value of $1.35B. The liquidity ratios which the firm has won as a quick ratio of 1.40, a current ratio of 1.70 and a debt-to-equity ratio of 0.46.

Having a look at past record, we’re going to look at various forwards or backwards shifting developments regarding BTU. The firm’s shares fell -28.85 percent in the past five business days and shrunk -26.27 percent in the past thirty business days. In the previous quarter, the stock fell -41.80 percent at some point. The output of the stock decreased -69.29 percent within the six-month closing period, while general annual output lost -80.83 percent. The company’s performance is now negative at -39.69% from the beginning of the calendar year.

Top Ships Inc. (TOPS) shares on Wednesday’s trading session, dropped -10.00 percent to see the stock exchange hands at $0.36 per unit. Lets a quick look at company’s past reported and future predictions of growth using the EPS Growth. EPS growth is a percentage change in standardized earnings per share over the trailing-twelve-month period to the current year-end. The company posted a value of -$15.94 as earning-per-share over the last full year, while a chance, will post -$0.13 for the coming year. The current EPS Growth rate for the company during the year is 95.10%. In-depth, if we analyze for the long-term EPS Growth, the out-come was -52.96% for the past five years.

The last trading period has seen Top Ships Inc. (TOPS) move -98.13% and -10.00% from the stock’s 52-week high and 52-week low prices respectively. The daily trading volume for Top Ships Inc. (NASDAQ:TOPS) over the last session is 1.72 million shares. TOPS has attracted considerable attention from traders and investors, a scenario that has seen its volume jump 270.1% compared to the previous one.

Investors focus on the profitability proportions of the company that how the company performs at profitability side. Return on equity ratio or ROE is a significant indicator for prospective investors as they would like to see just how effectively a business is using their cash to produce net earnings. As a return on equity, Top Ships Inc. (NASDAQ:TOPS) produces -19.60%. Because it would be easy and highly flexible, ROI measurement is among the most popular investment ratios. Executives could use it to evaluate the levels of performance on acquisitions of capital equipment whereas investors can determine that how the stock investment is better. The ROI entry for TOPS’s scenario is at -1.60%. Another main metric of a profitability ratio is the return on assets ratio or ROA that analyses how effectively a business can handle its assets to generate earnings over a duration of time. Top Ships Inc. (TOPS) generated -7.00% ROA for the trading twelve-month.

Volatility is just a proportion of the anticipated day by day value extend—the range where an informal investor works. Greater instability implies more noteworthy benefit or misfortune. After an ongoing check, Top Ships Inc. (TOPS) stock is found to be 19.59% volatile for the week, while 10.64% volatility is recorded for the month. The outstanding shares have been calculated 11.42M. Based on a recent bid, its distance from 20 days simple moving average is -42.86%, and its distance from 50 days simple moving average is -53.22% while it has a distance of -92.62% from the 200 days simple moving average.

The Williams Percent Range or Williams %R is a well-known specialized pointer made by Larry Williams to help recognize overbought and oversold circumstances. Top Ships Inc. (NASDAQ:TOPS)’s Williams Percent Range or Williams %R at the time of writing to be seated at 94.12% for 9-Day. It is also calculated for different time spans. Currently for this organization, Williams %R is stood at 95.29% for 14-Day, 95.29% for 20-Day, 97.53% for 50-Day and to be seated 99.55% for 100-Day. Relative Strength Index, or RSI(14), which is a technical analysis gauge, also used to measure momentum on a scale of zero to 100 for overbought and oversold. In the case of Top Ships Inc., the RSI reading has hit 15.16 for 14-Day.

Meridian Bioscience Inc. (VIVO) and Domtar Corporation (UFS)

POINT72 ASSET MANAGEMENT LP bought a fresh place in Meridian Bioscience Inc. (NASDAQ:VIVO). The institutional investor bought 513.1 thousand shares of the stock in a transaction took place on 12/31/2019. In another most recent transaction, which held on 12/31/2019, BLACKROCK FUND ADVISORS bought approximately 364.7 thousand shares of Meridian Bioscience Inc. In a separate transaction which took place on 12/31/2019, the institutional investor, JACOBS LEVY EQUITY MANAGEMENT, I bought 235.5 thousand shares of the company’s stock. The total Institutional investors and hedge funds own 89.90% of the company’s stock.

In the most recent purchasing and selling session, Meridian Bioscience Inc. (VIVO)’s share price increased by 9.24 percent to ratify at $8.16. A sum of 2068051 shares traded at recent session and its average exchanging volume remained at 514.97K shares. The 52-week price high and low points are important variables to concentrate on when assessing the current and prospective worth of a stock. Meridian Bioscience Inc. (VIVO) shares are taking a pay cut of -53.92% from the high point of 52 weeks and flying high of 12.55% from the low figure of 52 weeks.

Meridian Bioscience Inc. (VIVO) shares reached a high of $8.39 and dropped to a low of $7.56 until finishing in the latest session at $8.21. Traders and investors may also choose to study the ATR or Average True Range when concentrating on technical inventory assessment. Currently at 0.62 is the 14-day ATR for Meridian Bioscience Inc. (VIVO). The highest level of 52-weeks price has $17.71 and $7.25 for 52 weeks lowest level. After the recent changes in the price, the firm captured the enterprise value of $333.02M, with the price to earnings ratio of 18.34 and price to earnings growth ratio of 1.08. The liquidity ratios which the firm has won as a quick ratio of 3.10, a current ratio of 4.40 and a debt-to-equity ratio of 0.00.

Having a look at past record, we’re going to look at various forwards or backwards shifting developments regarding VIVO. The firm’s shares rose 3.16 percent in the past five business days and shrunk -20.70 percent in the past thirty business days. In the previous quarter, the stock fell -9.73 percent at some point. The output of the stock decreased -11.01 percent within the six-month closing period, while general annual output lost -52.03 percent. The company’s performance is now negative at -16.48% from the beginning of the calendar year.

According to WSJ, Meridian Bioscience Inc. (VIVO) obtained an estimated Hold proposal from the 2 brokerage firms currently keeping a deep eye on the stock performance as compares to its rivals. 0 equity research analysts rated the shares with a selling strategy, 2 gave a hold approach, 0 gave a purchase tip, 0 gave the firm a overweight advice and 0 put the stock under the underweight category. The average price goal of one year between several banks and credit unions that last year discussed the stock is $9.00.

Domtar Corporation (UFS) shares on Thursday’s trading session, dropped -5.44 percent to see the stock exchange hands at $28.34 per unit. Lets a quick look at company’s past reported and future predictions of growth using the EPS Growth. EPS growth is a percentage change in standardized earnings per share over the trailing-twelve-month period to the current year-end. The company posted a value of $1.28 as earning-per-share over the last full year, while a chance, will post $2.43 for the coming year. The current EPS Growth rate for the company during the year is 169.20% and predicted to reach at 96.13% for the coming year. In-depth, if we analyze for the long-term EPS Growth, the out-come was 26.40% for the past five years and the scenario is totally different as the current prediction is 5.00% for the next five year.

The last trading period has seen Domtar Corporation (UFS) move -45.80% and -4.83% from the stock’s 52-week high and 52-week low prices respectively. The daily trading volume for Domtar Corporation (NYSE:UFS) over the last session is 1.36 million shares. UFS has attracted considerable attention from traders and investors, a scenario that has seen its volume jump 78.08% compared to the previous one.

Investors focus on the profitability proportions of the company that how the company performs at profitability side. Return on equity ratio or ROE is a significant indicator for prospective investors as they would like to see just how effectively a business is using their cash to produce net earnings. As a return on equity, Domtar Corporation (NYSE:UFS) produces 11.10%. Because it would be easy and highly flexible, ROI measurement is among the most popular investment ratios. Executives could use it to evaluate the levels of performance on acquisitions of capital equipment whereas investors can determine that how the stock investment is better. The ROI entry for UFS’s scenario is at 9.50%. Another main metric of a profitability ratio is the return on assets ratio or ROA that analyses how effectively a business can handle its assets to generate earnings over a duration of time. Domtar Corporation (UFS) generated 5.70% ROA for the trading twelve-month.

Volatility is just a proportion of the anticipated day by day value extend—the range where an informal investor works. Greater instability implies more noteworthy benefit or misfortune. After an ongoing check, Domtar Corporation (UFS) stock is found to be 4.20% volatile for the week, while 3.48% volatility is recorded for the month. The outstanding shares have been calculated 56.84M. Based on a recent bid, its distance from 20 days simple moving average is -17.31%, and its distance from 50 days simple moving average is -22.76% while it has a distance of -25.37% from the 200 days simple moving average.

The Williams Percent Range or Williams %R is a well-known specialized pointer made by Larry Williams to help recognize overbought and oversold circumstances. Domtar Corporation (NYSE:UFS)’s Williams Percent Range or Williams %R at the time of writing to be seated at 99.21% for 9-Day. It is also calculated for different time spans. Currently for this organization, Williams %R is stood at 99.41% for 14-Day, 99.44% for 20-Day, 99.57% for 50-Day and to be seated 99.61% for 100-Day. Relative Strength Index, or RSI(14), which is a technical analysis gauge, also used to measure momentum on a scale of zero to 100 for overbought and oversold. In the case of Domtar Corporation, the RSI reading has hit 22.13 for 14-Day.