
Archives for February 11, 2020

Google Assistant’s ambient mode is coming to OnePlus phones

The feature will be available to all OnePlus 3 and newer devices.

If you own a OnePlus phone, you may soon be able to control your smart lights or control music playback through an interface that appears when you plug it in. That’s because Android’s Google Assistant-powered ambient mode has started rolling out to the brand’s devices, particularly all OnePlus 3 and newer models. Ambient mode, which takes over the screen while the phone is charging, makes it easy to accomplish several tasks without having to unlock your phone and fire up apps.

In addition to showing controls for smart devices and music playback, it also lets you set the alarm, as we as well as see your schedule and the weather. The ambient mode screen can also display a slideshow from Google Photos, essentially turning your phone into a digital photo frame.

A OnePlus staff member has announced the feature’s launch on the company’s forum, telling users to plug their devices in, click the notification that pops up and follow the guidance to set it up. You can also go to Google App Settings > Assistant > Devices (Phone) to enable it. Take note that it may take a week for all OnePlus users to get access to the feature, so just keep checking if it’s not enabled for you yet.


Microsoft’s redesigned Office apps for iOS are faster and simpler

Don’t expect many new features, though.

Microsoft is acting on its promise to give its mobile Office apps a makeover. It just released new iOS (and iPadOS) versions of Excel, PowerPoint and Word that all tout a “simpler, faster and more beautiful” redesign. Really, that’s another way of saying they have a more consistent look with an interface that helps you quickly edit documents when you’re away from your desk.

There isn’t a surfeit of new features. The largest changes are to Excel, where a newly available XLOOKUP function helps you find cell data. You can also read and respond to comments directly from email. And whichever app you’re using, there’s a new alt text pane that helps you add captions and mark elements as decorative. The spruced-up interface is really the centerpiece here –the new capabilities are mostly nice-to-have perks.

Spotify’s Kids app is coming to all Premium Family subscribers

The UK and Australia get it today ahead of a global rollout.

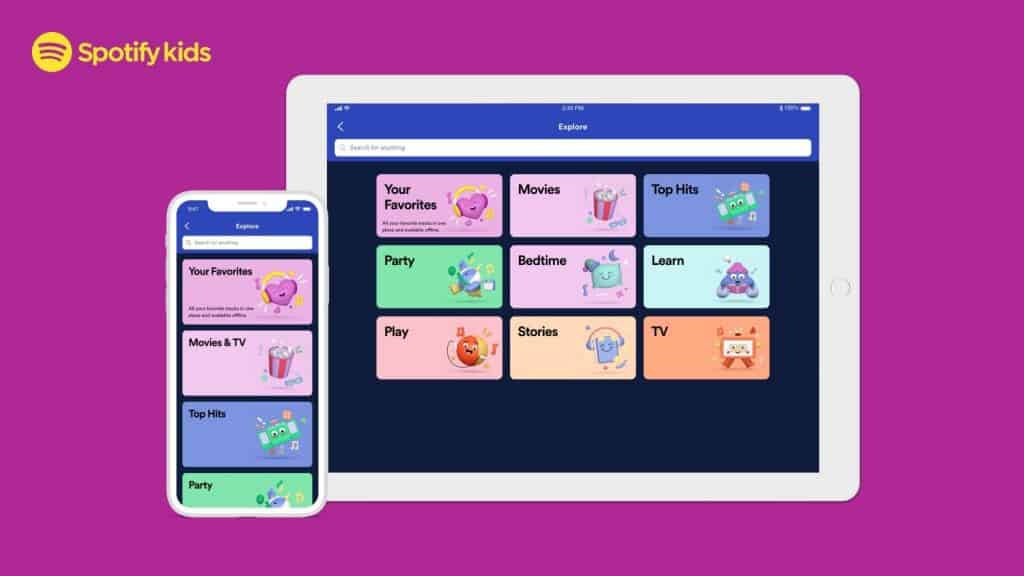
Spotify launched its standalone Kids app in Ireland back in October 2019 as a way to give younger listeners access to its varied catalog of music. Now, the company is rolling it out in beta in the UK and beyond, in a launch that coincides with Childnet International’s Safer Internet Day.

From today, anyone with a Spotify Premium Family subscription in the UK and Australia will be able to download the app for free onto any iOS or Android device. Kids can access a simplified and ad-free Spotify interface and listen to age-appropriate singalongs, soundtracks and stories, based on whether parents have selected “Audio for Younger Kids” or “Audio for Older Kids.” A global rollout will follow soon.

Also, if you’re a parent on Twitter, you’ve probably seen the viral Dinosaurs in Love track doing the rounds in recent times (which naturally now has its own video). The unfathomably bleak song — composed by singer Tom Rosenthal’s three-year-old daughter Fenn — tells the story of dinosaurs falling in love and subsequently being wiped out by the Big Bang. Well, that’ll be on the UK version of the Spotify Kids Music playlist from launch, as well as the worldwide Dinosaurs playlist. If you’ve been haunted by Baby Shark for the last year, it might serve as a welcome palate cleanser.

T-Mobile and Sprint merger approved by federal judge

The California Public Utilities Commission still needs to give the thumbs up, however.

T-Mobile and Sprint’s $26.5 billion merger is almost complete. Following months of delays and push back from high-profile authorities, a US district judge has ruled in the companies’ favor, allowing them to move within one step of concluding a deal that promises to deploy 5G service to 97 percent of Americans within three years.

In the ruling, US District Judge Victor Marrero agreed that while Sprint had attempted to compete with AT&T and Verizon, it had fallen short of its rivals: “The overwhelming view both within Sprint and in the wider industry is that Sprint is falling farther and farther short of the targets it must hit to remain relevant as a significant competitor.”

Judge Marrero also credited T-Mobile with forcing AT&T and Verizon (Engadget’s parent company) to improve their consumer offerings in response to its Uncarrier strategy and a push for cheaper and wider 5G coverage: “T-Mobile has redefined itself over the past decade as a maverick that has spurred the two largest players in its industry to make numerous pro-consumer changes. The proposed merger would allow the merged company to company to continue T-Mobile’s undeniably successful business strategy for the foreseeable future.”

The merger — which was approved by the Department of Justice in July 2019 and by the FCC in November 2019 — has faced major opposition from state attorneys general around the US. According to the lawsuit against this “megamerger” — signed by 18 attorney generals including Josh Shapiro — the merger would “severely undermine competition in the telecommunications sector,” in turn “driving up prices, limiting coverage, and diminishing quality.”

However, in order to obtain permission for the deal from the Department of Justice, T-Mobile and Sprint suggested a number of caveats designed to mitigate the union’s competitive advantage. The companies will have to sell the prepaid parts of Sprint’s business — Boost Mobile, Virgin Mobile, and Sprint prepaid — to competitor Dish, which will also gain access to the pair’s 20,000+ cell sites and retail locations. Sprint began shutting down Virgin Mobile and migrating customers to Boost Mobile on February 2nd.

Additionally, T-Mobile has to offer Dish “robust access” to its mobile network for seven years while the latter creates a 5G network of its own. According to the Justice Department, this will “enable a viable facilities-based competitor to enter the market.”

As well as rolling out what T-Mobile and Sprint call a “robust” 5G network, they’ve also pledged to provide 90 percent of Americans with access to mobile service with speeds of at least 100 Mbps within six years. Like the Department of Justice, the FCC had its own conditions for approval — if the companies don’t meet these goals, they could be fined more than $2 billion.

That’s not an insignificant sum, so those are not conditions the companies are likely to agree to lightly. However, with their extensive combined network and a goal that will force other carriers to take reactive measures — not to mention the struggle involved getting to this change — the new partnership is no doubt determined to succeed.

With this hurdle cleared, the deal now rests in the hands of the California Public Utilities Commission. T-Mobile and Sprint filed their merger with the CPUC in July 2018, but the organization has yet to make a decision.

Verizon owns Engadget’s parent company, Verizon Media. Rest assured, Verizon has no control over our coverage. Engadget remains editorially independent.

Stocks to Watch: Smith Micro Software Inc. (SMSI) and HC2 Holdings Inc. (HCHC)

ACADIAN ASSET MANAGEMENT LLC bought a fresh place in Smith Micro Software Inc. (NASDAQ:SMSI). The institutional investor bought 90.3 thousand shares of the stock in a transaction took place on 12/31/2019. In another most recent transaction, which held on 12/31/2019, VIRTU FINANCIAL BD LLC bought approximately 22.5 thousand shares of Smith Micro Software Inc.. In a separate transaction which took place on 12/31/2019, the institutional investor, ALPINE GLOBAL MANAGEMENT LLC bought 13.5 thousand shares of the company’s stock. The total Institutional investors and hedge funds own 18.50% of the company’s stock.

In the most recent purchasing and selling session, Smith Micro Software Inc. (SMSI)’s share price decreased by -0.16 percent to ratify at $6.17. A sum of 2567296 shares traded at recent session and its average exchanging volume remained at 425.79K shares. The 52-week price high and low points are important variables to concentrate on when assessing the current and prospective worth of a stock. Smith Micro Software Inc. (SMSI) shares are taking a pay cut of -10.58% from the high point of 52 weeks and flying high of 242.78% from the low figure of 52 weeks.

Smith Micro Software Inc. (SMSI) shares reached a high of $6.67 and dropped to a low of $5.88 until finishing in the latest session at $6.20. Traders and investors may also choose to study the ATR or Average True Range when concentrating on technical inventory assessment. Currently at 0.38 is the 14-day ATR for Smith Micro Software Inc. (SMSI). The highest level of 52-weeks price has $6.90 and $1.80 for 52 weeks lowest level. After the recent changes in the price, the firm captured the enterprise value of $220.65M, with the price to earnings ratio of 21.42 and price to earnings growth ratio of 1.99. The liquidity ratios which the firm has won as a quick ratio of 7.00, a current ratio of 7.00 and a debt-to-equity ratio of 0.00.

Having a look at past record, we’re going to look at various forwards or backwards shifting developments regarding SMSI. The firm’s shares rose 21.46 percent in the past five business days and grew 41.84 percent in the past thirty business days. In the previous quarter, the stock rose 32.40 percent at some point. The output of the stock decreased -1.28 percent within the six-month closing period, while general annual output gained 229.95 percent. The company’s performance is now positive at 55.03% from the beginning of the calendar year.

According to WSJ, Smith Micro Software Inc. (SMSI) obtained an estimated Buy proposal from the 2 brokerage firms currently keeping a deep eye on the stock performance as compares to its rivals. 0 equity research analysts rated the shares with a selling strategy, 0 gave a hold approach, 2 gave a purchase tip, 0 gave the firm a overweight advice and 0 put the stock under the underweight category. The average price goal of one year between several banks and credit unions that last year discussed the stock is $7.88.

HC2 Holdings Inc. (HCHC) shares on Monday’s trading session, jumped 14.00 percent to see the stock exchange hands at $3.99 per unit. Lets a quick look at company’s past reported and future predictions of growth using the EPS Growth. EPS growth is a percentage change in standardized earnings per share over the trailing-twelve-month period to the current year-end. The company posted a value of -$0.41 as earning-per-share over the last full year, while a chance, will post -$1.24 for the coming year. The current EPS Growth rate for the company during the year is 597.80% and predicted to reach at -396.00% for the coming year. In-depth, if we analyze for the long-term EPS Growth, the out-come was 36.00% for the past five years.

The last trading period has seen HC2 Holdings Inc. (HCHC) move 10.22% and 110.00% from the stock’s 52-week high and 52-week low prices respectively. The daily trading volume for HC2 Holdings Inc. (NYSE:HCHC) over the last session is 1.21 million shares. HCHC has attracted considerable attention from traders and investors, a scenario that has seen its volume jump 248.85% compared to the previous one.

Investors focus on the profitability proportions of the company that how the company performs at profitability side. Return on equity ratio or ROE is a significant indicator for prospective investors as they would like to see just how effectively a business is using their cash to produce net earnings. As a return on equity, HC2 Holdings Inc. (NYSE:HCHC) produces -6.10%. Because it would be easy and highly flexible, ROI measurement is among the most popular investment ratios. Executives could use it to evaluate the levels of performance on acquisitions of capital equipment whereas investors can determine that how the stock investment is better. The ROI entry for HCHC’s scenario is at 19.40%. Another main metric of a profitability ratio is the return on assets ratio or ROA that analyses how effectively a business can handle its assets to generate earnings over a duration of time. HC2 Holdings Inc. (HCHC) generated -0.20% ROA for the trading twelve-month.

Volatility is just a proportion of the anticipated day by day value extend—the range where an informal investor works. Greater instability implies more noteworthy benefit or misfortune. After an ongoing check, HC2 Holdings Inc. (HCHC) stock is found to be 7.38% volatile for the week, while 7.05% volatility is recorded for the month. The outstanding shares have been calculated 43.83M. Based on a recent bid, its distance from 20 days simple moving average is 42.02%, and its distance from 50 days simple moving average is 63.85% while it has a distance of 72.15% from the 200 days simple moving average.

The Williams Percent Range or Williams %R is a well-known specialized pointer made by Larry Williams to help recognize overbought and oversold circumstances. HC2 Holdings Inc. (NYSE:HCHC)’s Williams Percent Range or Williams %R at the time of writing to be seated at 0.79% for 9-Day. It is also calculated for different time spans. Currently for this organization, Williams %R is stood at 0.62% for 14-Day, 0.57% for 20-Day, 0.50% for 50-Day and to be seated 0.49% for 100-Day. Relative Strength Index, or RSI(14), which is a technical analysis gauge, also used to measure momentum on a scale of zero to 100 for overbought and oversold. In the case of HC2 Holdings Inc., the RSI reading has hit 79.20 for 14-Day.

Stocks to Watch: Plug Power Inc. (PLUG) and Penn National Gaming Inc. (PENN)

PINNACLE ASSOCIATES LTD. bought a fresh place in Plug Power Inc. (NASDAQ:PLUG). The institutional investor bought 2.7 million shares of the stock in a transaction took place on 12/31/2019. In another most recent transaction, which held on 12/31/2019, SSGA FUNDS MANAGEMENT, INC. bought approximately 311.7 thousand shares of Plug Power Inc. In a separate transaction which took place on 12/31/2019, the institutional investor, DEKA INVESTMENT GMBH bought 230.0 thousand shares of the company’s stock. The total Institutional investors and hedge funds own 30.20% of the company’s stock.

In the most recent purchasing and selling session, Plug Power Inc. (PLUG)’s share price decreased by 0.00 percent to ratify at $4.25. A sum of 7410478 shares traded at recent session and its average exchanging volume remained at 12.96M shares. The 52-week price high and low points are important variables to concentrate on when assessing the current and prospective worth of a stock. Plug Power Inc. (PLUG) shares are taking a pay cut of -6.18% from the high point of 52 weeks and flying high of 221.97% from the low figure of 52 weeks.

Plug Power Inc. (PLUG) shares reached a high of $4.31 and dropped to a low of $4.13 until finishing in the latest session at $4.25. Traders and investors may also choose to study the ATR or Average True Range when concentrating on technical inventory assessment. Currently at 0.26 is the 14-day ATR for Plug Power Inc. (PLUG). The highest level of 52-weeks price has $4.53 and $1.32 for 52 weeks lowest level. After the recent changes in the price, the firm captured the enterprise value of $1.48B. The liquidity ratios which the firm has won as a quick ratio of 0.90, a current ratio of 1.60.

Having a look at past record, we’re going to look at various forwards or backwards shifting developments regarding PLUG. The firm’s shares rose 9.96 percent in the past five business days and grew 4.17 percent in the past thirty business days. In the previous quarter, the stock rose 49.12 percent at some point. The output of the stock increased 102.38 percent within the six-month closing period, while general annual output gained 217.16 percent. The company’s performance is now positive at 34.49% from the beginning of the calendar year.

According to WSJ, Plug Power Inc. (PLUG) obtained an estimated Buy proposal from the 8 brokerage firms currently keeping a deep eye on the stock performance as compares to its rivals. 0 equity research analysts rated the shares with a selling strategy, 1 gave a hold approach, 7 gave a purchase tip, 0 gave the firm a overweight advice and 0 put the stock under the underweight category. The average price goal of one year between several banks and credit unions that last year discussed the stock is $4.50.

Penn National Gaming Inc. (PENN) shares on Friday’s trading session, dropped -1.66 percent to see the stock exchange hands at $34.32 per unit. Lets a quick look at company’s past reported and future predictions of growth using the EPS Growth. EPS growth is a percentage change in standardized earnings per share over the trailing-twelve-month period to the current year-end. The company posted a value of $0.79 as earning-per-share over the last full year, while a chance, will post $2.16 for the coming year. The current EPS Growth rate for the company during the year is -88.10% and predicted to reach at 42.17% for the coming year. In-depth, if we analyze for the long-term EPS Growth, the out-come was 16.20% for the past five years and the scenario is totally different as the current prediction is 37.12% for the next five year.

The last trading period has seen Penn National Gaming Inc. (PENN) move -3.78% and 105.26% from the stock’s 52-week high and 52-week low prices respectively. The daily trading volume for Penn National Gaming Inc. (NASDAQ:PENN) over the last session is 3.26 million shares. PENN has attracted considerable attention from traders and investors, a scenario that has seen its volume jump 80.87% compared to the previous one.

Investors focus on the profitability proportions of the company that how the company performs at profitability side. Return on equity ratio or ROE is a significant indicator for prospective investors as they would like to see just how effectively a business is using their cash to produce net earnings. As a return on equity, Penn National Gaming Inc. (NASDAQ:PENN) produces 5.90%. Because it would be easy and highly flexible, ROI measurement is among the most popular investment ratios. Executives could use it to evaluate the levels of performance on acquisitions of capital equipment whereas investors can determine that how the stock investment is better. The ROI entry for PENN’s scenario is at 6.00%. Another main metric of a profitability ratio is the return on assets ratio or ROA that analyses how effectively a business can handle its assets to generate earnings over a duration of time. Penn National Gaming Inc. (PENN) generated 0.70% ROA for the trading twelve-month.

Volatility is just a proportion of the anticipated day by day value extend—the range where an informal investor works. Greater instability implies more noteworthy benefit or misfortune. After an ongoing check, Penn National Gaming Inc. (PENN) stock is found to be 6.44% volatile for the week, while 4.60% volatility is recorded for the month. The outstanding shares have been calculated 119.95M. Based on a recent bid, its distance from 20 days simple moving average is 22.98%, and its distance from 50 days simple moving average is 32.01% while it has a distance of 61.00% from the 200 days simple moving average.

The Williams Percent Range or Williams %R is a well-known specialized pointer made by Larry Williams to help recognize overbought and oversold circumstances. Penn National Gaming Inc. (NASDAQ:PENN)’s Williams Percent Range or Williams %R at the time of writing to be seated at 13.12% for 9-Day. It is also calculated for different time spans. Currently for this organization, Williams %R is stood at 12.35% for 14-Day, 12.35% for 20-Day, 9.99% for 50-Day and to be seated 7.64% for 100-Day. Relative Strength Index, or RSI(14), which is a technical analysis gauge, also used to measure momentum on a scale of zero to 100 for overbought and oversold. In the case of Penn National Gaming Inc., the RSI reading has hit 77.90 for 14-Day.