Archives for May 10, 2019

Jeff Bezos reveals his ‘Blue Moon’ lunar lander

Blue Origin is also working on a rocket engine for its moon missions.

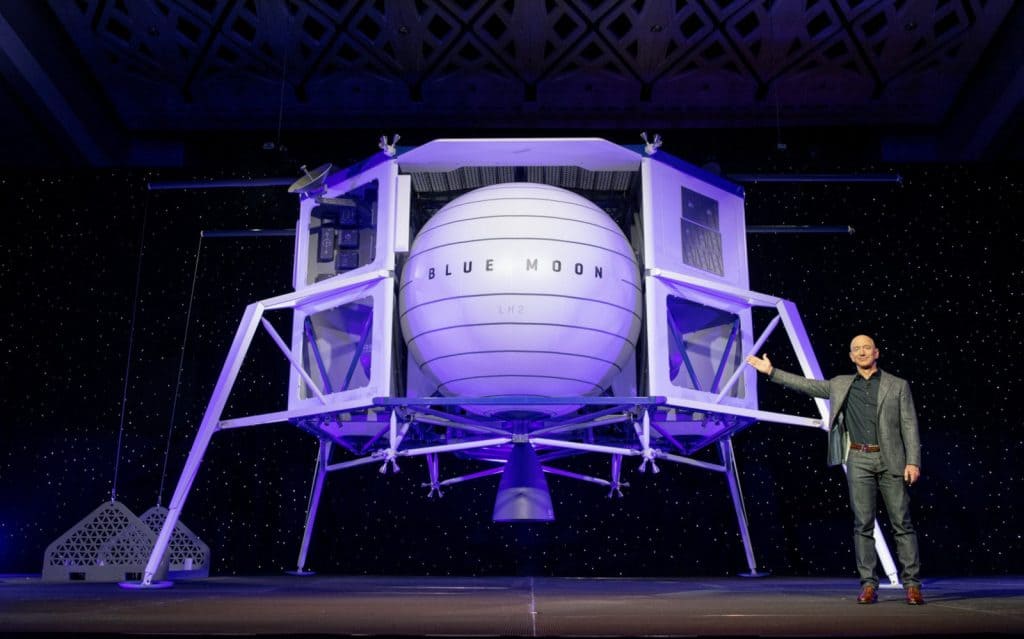
Blue Origin is building a lunar lander aptly called the Blue Moon. Jeff Bezos has announced his space company’s shared goal with NASA to go back to our planet’s fateful companion in the next few years at an event for media and space industry executives. There, the tech exec has also revealed that Blue Origin is developing a new engine called BE-7 with a 10,000 lbf thrust, strong enough to power the rocket that’s ferrying the lander and its large payloads to space. Its first test fire could happen as soon as this summer.

Blue Origin says the cargo variant it has just revealed can carry 3.6 metric tons to its destination. It’s also working on another variant that’s capable of carrying a “6.5-metric-ton, human-rated ascent stage.” While Bezos didn’t mention particular dates, the company believes it can meet the government’s goal of putting Americans back on the moon by 2024.

The Blue Moon initiative seeks to build infrastructure on the surface of Earth’s natural satellite to the point that entrepreneurs can start building space businesses. Bezos talked about the possibility of harnessing resources there for energy back home, since ours are bound to run out in the future. In addition, he said the moon is a good place for manufacturing, since it will take 24 times less energy to haul materials from its surface compared to the Earth due to its lower gravity.

A couple of years ago, when Bezos first teased the project, he said it would start by sending a couple of tons of cargo to the moon to build a lunar base — it sounds like that’s still what the company intends to do. “It’s time to go back to the moon, this time to stay,” he said.

With Android Q, Google is pushing for more elegant, standardized gestures

You’re going to see Android Q’s new gestures all over the place.

At last year’s developer conference, Google gave us our first taste of Android Pie’s gesture-based navigation system. It was, uh, pretty rough: the classic, three-button navigation scheme was replaced with a back button, a “pill” and a handful of swipe gestures that, to me at least, never felt particularly elegant or natural. Thankfully, Allen Huang, Google’s product manager for Android’s system interface, explained it was always meant to be a transitional step and never meant for it to last “in its current form” for more than a year.

That’s a big deal because, as Huang himself concedes, asking users to re-adapt to the fundamentals of a newly updated phone is pretty lousy. Muscle memory sets in, people get used to a system’s quirks and life goes on… until the next time Google changes how Android navigation works. And yet, that’s exactly what the search giant did with this year’s Android Q release: you can either run with those classic Android buttons or embrace a brand new, no-buttons-involved gesture system.

Swipe up from the bottom of the display and you’ll land on your home screen. Swipe up from the home screen, and your app launcher springs to life. Swipe in from either side of the display and you’ll go back one level. Simple enough, right?

For now, at least, the only real action that seems missing in the public Q beta is a way to activate Google Assistant. Sure, if you have a Pixel, you can use Active Sense, and everyone else can say “OK, Google.” In future Android Q builds, though, you’ll also be able to swipe diagonally inward from the bottom corners of the screen to launch Google Assistant. In the non-final build running on Huang’s own Pixel, this motion is signified by a bar of Google-y colors swelling out to stretch across the bottom of the screen.

Even in its not-quite-finished form, these new gestures feel like a huge improvement over the mixed bag that shipped with Android Pie. According to Huang, the similarity to Apple’s gestures was a curious case of convergence in design. Since phone screens only have two sides and a bottom and Android has four main navigation actions (go home, go back, view recent apps and activate the Assistant), there were only so many viable gesture options to work with. It might seem familiar, sure, but the system Google has landed on makes sense in a way that last year’s gestures didn’t.

To Google’s credit, though, it’s offering users a choice. When new Android Q devices start going on sale later this year, they’ll all have the classic three-button navigation system and the new swipe-centric system we’ve been talking about. And to be clear, I do mean all new Android Q devices will have these options.

To make the act of using Android feel as universal and consistent as possible, device makers like Samsung, Huawei, LG and the rest will have to offer these navigation systems on new phones, even if they’ve developed their own gesture interfaces. If you already have an Android phone that you eventually update to Q, your navigation system won’t change by default. (For now, that seems like the only way to keep the gesture controls that debuted with Android Pie.)

The benefits to this approach are pretty clear: if you ever switch Android phones post-Q, you probably won’t face a steep learning curve as you get acquainted with your new device. And by ensuring that all new Android Q devices have the new gesture navigation, Google is making it so that devices with smaller screens don’t feel nearly as cramped. That said, most phone makers of note have already cooked up their own gesture navigation systems in response to the (lackluster) option available in Android P, and the last thing Google wants to do is take that option away from users.

The company will strongly “encourage” its hardware partners to embrace Android Q’s navigation schemes, but the Samsungs, OnePluses and Huaweis of the world can continue to make custom skins with custom gesture interfaces for people who really want to use something different. The catch, according to a Google spokesperson is that those companies have to offer Google’s gestures right out of the box if they want to include some custom gestures.

Huang said the reason for this push to standardize navigation is because of app developers: their job gets infinitely more difficult if they have to worry about how different swipe gestures performed inside apps gets misinterpreted as something else. By insisting on one (or two) main modes of interaction, Google is trying to take some of the load off developers who might otherwise have to design their software with specific devices in mind. As far as Huang is concerned, that doesn’t lead anywhere good.

“If everyone does their own thing, Android apps are going to get worse,” he added.

And to be clear, Google hasn’t just sprung this on its hardware partners this week. According to Huang, the company reached out to major phone makers well in advance, and some OEMs have specifically asked Google to develop standard Android gesture controls. Well, wish granted, whoever you are.

With Android Q’s summer launch getting closer by the day, Google doesn’t have much time left to iron out the early issues with its new gesture controls. Based on what I’ve experienced in the last few days, though, Google has taken some significant steps forward when it comes to the ease and quality of interacting with Android. That’s only going to become more important as it tries to connect with its next billion users, so here’s hoping the coming months are well spent.

Stocks to Watch: Mustang Bio, Inc. (MBIO) and Seadrill Partners LLC (SDLP) in the spotlight

The price of Mustang Bio, Inc. (NASDAQ:MBIO) went up by $0.03 now trading at $4.11. Their shares witnessed a 88.53% increase from the 52-week low price of $2.18 they recorded on 2018-12-27. Even though it is still -148.18% behind the $10.2 high touched on 2019-04-18. The last few days have been good for the stock, as its price has grew by 1.99% during the week. It has also performed poorly over the past three months, as it lost around -6.8% while it has so far retreated around -53.4% during the course of a year. The stock of MBIO recorded 39.8% uptrend from the beginning of this year till date. The 12-month potential price target for Mustang Bio, Inc. is set at $19.5. This target means that the stock has an upside potential to increase by 374.45% from the current trading price.

2 institutions entered new Mustang Bio, Inc. (NASDAQ:MBIO) positions, 8 added to their existing positions in these shares, 25 lowered their positions, and 7 exited their positions entirely.

Mustang Bio, Inc. (MBIO) trade volume has decreased by -53.05% as around 577,409 shares were sold when compared with its 50-day average volume of traded shares which is 1,229,908. At the moment, MBIO is witnessing a downtrend, as it is trading -2.24% below its 20-day SMA, 3.8% above its 50-day SMA, and -10.15% above its 200-day SMA. The company runs an ROE of roughly -65%, with financial analysts predicting that their earnings per share growth will be around 0% per annum for the next five year. This will be compared to the 0% decrease witnessed over the past five years.

The first technical resistance point for Mustang Bio, Inc. (NASDAQ:MBIO) will likely come at $4.23, marking a 2.84% premium to the current level. The second resistance point is at $4.34, about 5.3% premium to its current market price. On the other hand, inability to breach the immediate hurdles can drag it down to $3.88, the lower end of the range. MBIO’s 14-day MACD is -0.63 and this negative figure indicates a downward trading trend. The company’s 14-day RSI (relative strength index) score is 49.22, which shows that its stock has been neutral. The 20-day historical volatility for the stock stands at 281.47 percent, which is high when compared to that of the 50-day’s 188.02 percent.

The shares of Seadrill Partners LLC (NYSE:SDLP) has decreased by -0.11%, and now trading at $0.66 on the Wall Street in the intra-day deal, with their shares traded now around 214,165. This is a decline of -30,775 shares over the average 244,940 shares that were traded daily over the last three months. The stock that is trading at $0.66 went lower by 0% from its 52-week low of $0.66 that it attained back on 2019-05-08. The stock recorded a 52-week high of $3.94 nearly 304 days ago on 2018-07-09.

SDLP stock hasn’t performed well over the past 30 days, as it lost -22.04% while its price plunged by -61.88% year-to-date (YTD). Looking at the last few days, it has been tough for the stock, as it tumbled -3.04% over the last week. The stock’s 12-month potential target price is now at $2.5.

Seadrill Partners LLC (NYSE:SDLP) has been utilizing an ROE that is roughly 4.1%, with stock analysts predicting that the company’s EPS for the next five years will go up by 1% per year, following the -28.9% drop that was witnessed during the past five years. The stock at the moment is on a downtrend, trading -10.86% below its 20-day SMA, -22.31% below its 50-day SMA, and -70.72% below its 200-day SMA. In percentage terms, the aggregate Seadrill Partners LLC shares held by institutional investors is 19.2%. 2 institutions jumped in to acquire Seadrill Partners LLC (SDLP) fresh stake, 18 added to their current holdings in these shares, 21 lowered their positions, and 12 left no stake in the company.

The stock’s 9-day MACD is -0.02 and this negative figure indicates a downward trading trend. The company’s 9-day RSI score is 31.71, which shows that its stock has been neutral. The 20-day historical volatility for the shares stand at 55.5 percent, which is more when compared to that of the 50-day’s 52.63 percent. On the daily chart, we see that the stock could reach the first level of resistance at $0.68, sporting a 2.94% premium to the current level. The next resistance point is at $0.7, representing nearly 5.71% premium to the current market price of Seadrill Partners LLC (SDLP). On the other hand, failure to breach the immediate hurdles can drag it down to $0.62, the lower end of the range.

Stocks to Watch: Focus on Hallador Energy Company (HNRG), Wireless Telecom Group, Inc. (WTT)

The price of Hallador Energy Company (NASDAQ:HNRG) went up by $0.18 now trading at $5.46. Their shares witnessed a 14.95% increase from the 52-week low price of $4.75 they recorded on 2018-12-24. Even though it is still -46.15% behind the $7.98 high touched on 2018-06-08. The last few days have been good for the stock, as its price has grew by 8.33% during the week. It has also performed poorly over the past three months, as it lost around -3.02% while it has so far retreated around -19.59% during the course of a year. The stock of HNRG recorded 7.69% uptrend from the beginning of this year till date. The 12-month potential price target for Hallador Energy Company is set at $10. This target means that the stock has an upside potential to increase by 83.15% from the current trading price.

6 institutions entered new Hallador Energy Company (NASDAQ:HNRG) positions, 33 added to their existing positions in these shares, 40 lowered their positions, and 11 exited their positions entirely.

Hallador Energy Company (HNRG) trade volume has increased by 73.66% as around 111,127 shares were sold when compared with its 50-day average volume of traded shares which is 63,990. At the moment, HNRG is witnessing a uptrend, as it is trading 8.24% above its 20-day SMA, 4.72% above its 50-day SMA, and -4.5% above its 200-day SMA. The company runs an ROE of roughly 2.9%, with financial analysts predicting that their earnings per share growth will be around 0% per annum for the next five year. This will be compared to the -20.4% decrease witnessed over the past five years.

The first technical resistance point for Hallador Energy Company (NASDAQ:HNRG) will likely come at $5.51, marking a 0.91% premium to the current level. The second resistance point is at $5.57, about 1.97% premium to its current market price. On the other hand, inability to breach the immediate hurdles can drag it down to $5.3, the lower end of the range. HNRG’s 14-day MACD is 0.17 and this positive figure indicates an upward trading trend. The company’s 14-day RSI (relative strength index) score is 63.29, which shows that its stock has been neutral. The 20-day historical volatility for the stock stands at 32.39 percent, which is low when compared to that of the 50-day’s 40.44 percent.

The shares of Wireless Telecom Group, Inc. (NYSE:WTT) has increased by 2.05%, and now trading at $1.49 on the Wall Street in the intra-day deal, with their shares traded now around 95,050. This is a rise of 61,494 shares over the average 33,556 shares that were traded daily over the last three months. The stock that is trading at $1.49 went higher by 6.43% from its 52-week low of $1.4 that it attained back on 2018-12-24. The stock recorded a 52-week high of $2.45 nearly 356 days ago on 2018-05-18.

WTT stock hasn’t performed well over the past 30 days, as it lost -0.67% while its price plunged by -15.82% year-to-date (YTD). Looking at the last few days, it has been good for the stock, as it rose 1.36% over the last week. The stock’s 12-month potential target price is now at $3. This means that the stock price might likely increase by 101.34% from its current trading price. 1 out of 1 Wall Street analysts which represents 100% rated the stock as a buy while the remaining 0% rated it as a hold, with 0% of analysts rating it as a sell.

Wireless Telecom Group, Inc. (NYSE:WTT) has been utilizing an ROE that is roughly 0.1%, with stock analysts predicting that the company’s EPS for the next five years will go down by 0% per year, following the -59.9% drop that was witnessed during the past five years. The stock at the moment is on a downtrend, trading -0.07% below its 20-day SMA, -5.75% below its 50-day SMA, and -14.02% below its 200-day SMA. In percentage terms, the aggregate Wireless Telecom Group, Inc. shares held by institutional investors is 26.5%. 0 institutions jumped in to acquire Wireless Telecom Group, Inc. (WTT) fresh stake, 2 added to their current holdings in these shares, 14 lowered their positions, and 2 left no stake in the company.

The stock’s 9-day MACD is -0.03 and this negative figure indicates a downward trading trend. The company’s 9-day RSI score is 48.62, which shows that its stock has been neutral. The 20-day historical volatility for the shares stand at 35.79 percent, which is less when compared to that of the 50-day’s 51.26 percent. On the daily chart, we see that the stock could reach the first level of resistance at $1.55, sporting a 3.87% premium to the current level. The next resistance point is at $1.61, representing nearly 7.45% premium to the current market price of Wireless Telecom Group, Inc. (WTT). On the other hand, failure to breach the immediate hurdles can drag it down to $1.39, the lower end of the range.

Stocks to Watch: Eyes on Iveric Bio, Inc. (ISEE), Capital Senior Living Corporation (CSU)

The price of IVERIC bio, Inc. (NASDAQ:ISEE) went down by $0 now trading at $1.44. Their shares witnessed a 41.18% increase from the 52-week low price of $1.02 they recorded on 2018-12-27. Even though it is still -212.5% behind the $4.5 high touched on 2018-06-07. The last few days have been good for the stock, as its price has grew by 8.27% during the week. It has also performed better over the past three months, as it added around 12.5% while it has so far retreated around -45.25% during the course of a year. The stock of ISEE recorded 20% uptrend from the beginning of this year till date. The 12-month potential price target for IVERIC bio, Inc. is set at $4. This target means that the stock has an upside potential to increase by 177.78% from the current trading price.

4 institutions entered new IVERIC bio, Inc. (NASDAQ:ISEE) positions, 21 added to their existing positions in these shares, 35 lowered their positions, and 11 exited their positions entirely.

IVERIC bio, Inc. (ISEE) trade volume has increased by 30.55% as around 255,425 shares were sold when compared with its 50-day average volume of traded shares which is 195,660. At the moment, ISEE is witnessing a uptrend, as it is trading 2.2% above its 20-day SMA, -1.18% below its 50-day SMA, and -21.27% below its 200-day SMA. The company runs an ROE of roughly 144.2%, with financial analysts predicting that their earnings per share growth will be around 0% per annum for the next five year. This will be compared to the 17.8% increase witnessed over the past five years.

The first technical resistance point for IVERIC bio, Inc. (NASDAQ:ISEE) will likely come at $1.45, marking a 0.69% premium to the current level. The second resistance point is at $1.47, about 2.04% premium to its current market price. On the other hand, inability to breach the immediate hurdles can drag it down to $1.4, the lower end of the range. ISEE’s 14-day MACD is 0.03 and this positive figure indicates an upward trading trend. The company’s 14-day RSI (relative strength index) score is 53.56, which shows that its stock has been neutral. The 20-day historical volatility for the stock stands at 32.85 percent, which is low when compared to that of the 50-day’s 37.86 percent.

The shares of Capital Senior Living Corporation (NYSE:CSU) has increased by 0.93%, and now trading at $4.33 on the Wall Street in the intra-day deal, with their shares traded now around 251,206. This is a decline of -73,166 shares over the average 324,372 shares that were traded daily over the last three months. The stock that is trading at $4.33 went higher by 13.35% from its 52-week low of $3.82 that it attained back on 2019-03-07. The stock recorded a 52-week high of $11.73 nearly 322 days ago on 2018-06-21.

CSU stock has performed well over the past 30 days, as it added 9.34% while its price plunged by -36.32% year-to-date (YTD). Looking at the last few days, it has been good for the stock, as it rose 9.62% over the last week. The stock’s 12-month potential target price is now at $5.75. This means that the stock price might likely increase by 32.79% from its current trading price. 2 out of 4 Wall Street analysts which represents 50% rated the stock as a buy while the remaining 25% rated it as a hold, with 25% of analysts rating it as a sell.

Capital Senior Living Corporation (NYSE:CSU) has been utilizing an ROE that is roughly -89.7%, with stock analysts predicting that the company’s EPS for the next five years will go up by 19.2% per year, following the -24.6% drop that was witnessed during the past five years. The stock at the moment is on a uptrend, trading 6.17% above its 20-day SMA, 1.61% above its 50-day SMA, and -39.35% below its 200-day SMA. In percentage terms, the aggregate Capital Senior Living Corporation shares held by institutional investors is 84.6%. 7 institutions jumped in to acquire Capital Senior Living Corporation (CSU) fresh stake, 26 added to their current holdings in these shares, 48 lowered their positions, and 15 left no stake in the company.

The stock’s 9-day MACD is 0.11 and this positive figure indicates an upward trading trend. The company’s 9-day RSI score is 61.73, which shows that its stock has been neutral. The 20-day historical volatility for the shares stand at 48.34 percent, which is less when compared to that of the 50-day’s 70.36 percent. On the daily chart, we see that the stock could reach the first level of resistance at $4.38, sporting a 1.14% premium to the current level. The next resistance point is at $4.43, representing nearly 2.26% premium to the current market price of Capital Senior Living Corporation (CSU). On the other hand, failure to breach the immediate hurdles can drag it down to $4.21, the lower end of the range.

Stocks to Watch: Rogers Communications Inc. Class B Non-voting Shares (TSX:RCI.B) Up +1.66%

At close of market on Tuesday, Rogers Communications Inc. Class B Non-voting Shares (TSX:RCI.B) stock finished trading at +1.66%, bringing the stock price to $69.35 on the Toronto Stock Exchange. The stock price saw a low of $68.13 and a high of $69.46.

The company’s stock was traded 8,980 times with a total of 1,756,102 shares traded.

Rogers Communications Inc. Class B Non-voting Shares has a market cap of $27.86 billion, with 401.76 million shares in issue.

Rogers is the largest wireless service provider in Canada, with its more than 10 million subscribers equating to one third of the total Canadian market. Rogers’ wireless business accounted for over 60% of the company’s total sales in 2018 and has increasingly provided a bigger portion of total company sales over the last several years. Rogers’ cable segment, which provides about one fourth of total sales, offers home Internet, television, and landline phone service to consumers and businesses. Remaining sales come from Rogers’ media unit, which owns and operates various television and radio stations, digital media and publishing assets, and the Toronto Blue Jays. Rogers’ significant exposure to sports also includes ownership stakes in the Toronto Maple Leafs, Raptors, FC, and Argonauts.