Archives for May 2, 2019

Google Pixel 3a features leak in exquisite detail

It might even start at a low price.

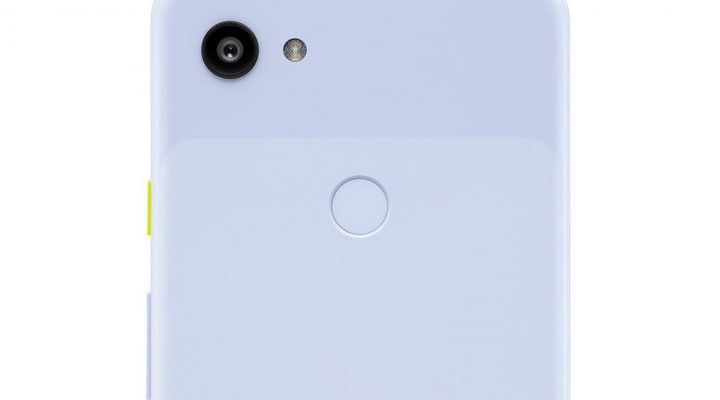
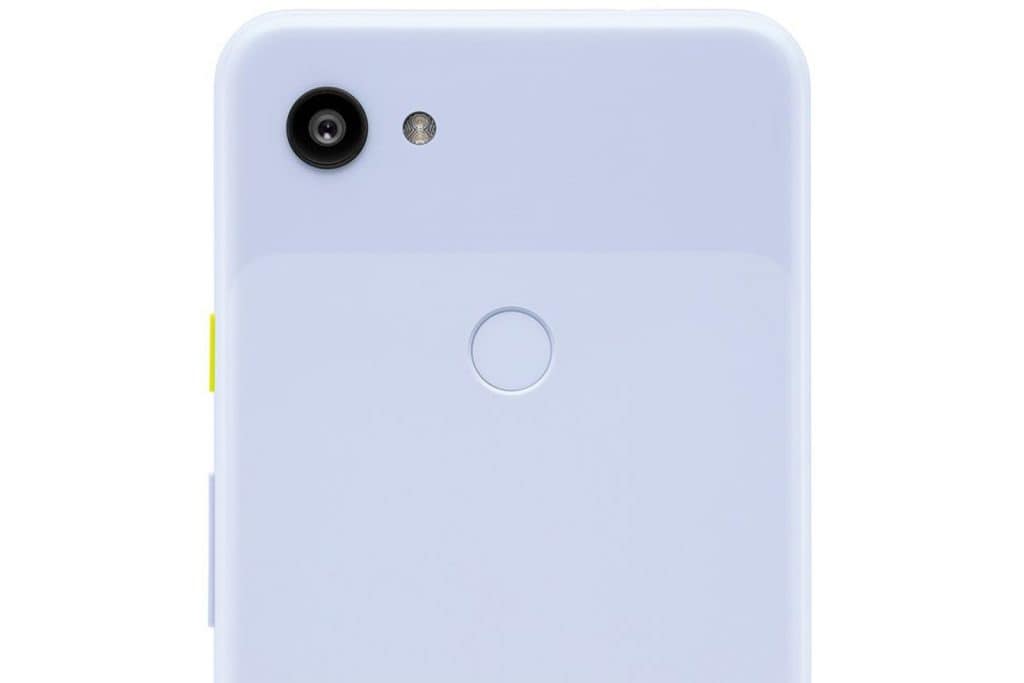
If Google wanted to preserve what few secrets were left about its Pixel 3a phones, it’s probably out of luck. Droid Life has obtained images and extensive feature lists for both the 5.6-inch Pixel 3a and its 6-inch 3a XL counterpart, including what appear to be graphics for the devices’ promo website. It’s now virtually certain that they’ll come in purple (described in one leak as “Purple-ish”) in addition to the usual black and white options, and they’ll come with photographic perks of the high-end Pixel 3 like Night Sight.

You can also expect squeeze sensors, 4GB of RAM, 64GB of baseline storage, a 12-megapixel rear camera and an 8MP selfie shooter. The battery life could be healthy. While the promos don’t confirm the use of Snapdragon 670 or 710 chips, those combined with 3,000mAh (on the base 3a) and 3,700mAh (on the XL) power packs might get you through the day relatively easily. Earlier leaks pointed to a 2,160 x 1,080 screen on the smaller phone and 2,220 x 1,080 on its larger sibiling.

The real draw might be the price. This is Tech Today has posted a video that both shows a seemingly legitimate box for the Pixel 3a (in that aforementioned “Purple-ish” shade) and claims that Google’s mid-tier phones will start at $399 US for the regular 3a and $479 for its XL counterpart. You’ll want to take those numbers with a grain of salt given that there’s no tangible evidence, but those price tags could make the lineup appealing — the 3a would start at half the official price of the standard 3. That could make it a better deal for anyone who wants the Pixel experience without paying for advanced processor and display technology that might go to waste.

Chrome OS unifies Google Assistant and device searches

You can also expect better hardware support.

You don’t have to be quite so picky when you start a search on your Chromebook. Google has released Chrome OS 74, whose cornerstone is a reworked search experience that unifies Google Assistant, on-device and web search. Tap the search box and you just have to enter whatever you’re looking for, whether it’s an app or tomorrow’s forecast. Suffice it to say this could be less confusing if you’re a newcomer, or just don’t want to switch search methods.

There’s more even if you don’t particularly care for the streamlined search. Linux apps finally output audio, and the Android Camera app now supports USB devices. You can also annotate documents if you’re using the Chrome PDF viewer. All told, Chrome OS plays much more nicely with the other parts of Google’s ecosystem.

Stocks to Watch: Focus on Veracyte, Inc. (VCYT), Navigant Consulting, Inc. (NCI)

The price of Veracyte, Inc. (NASDAQ:VCYT) went down by $-0.2 now trading at $22.87. Their shares witnessed a 311.33% increase from the 52-week low price of $5.56 they recorded on 2018-05-03. Even though it is still -16.97% behind the $26.75 high touched on 2019-04-08. The last few days have been rough for the stock, as its price has decreased by -3.54% during the week. It has also performed better over the past three months, as it added around 28.99% while it has so far climbed around 275.53% during the course of a year. The stock of VCYT recorded 81.8% uptrend from the beginning of this year till date. The 12-month potential price target for Veracyte, Inc. is set at $24.33. This target means that the stock has an upside potential to increase by 6.38% from the current trading price.

19 institutions entered new Veracyte, Inc. (NASDAQ:VCYT) positions, 62 added to their existing positions in these shares, 62 lowered their positions, and 12 exited their positions entirely.

Veracyte, Inc. (VCYT) trade volume has decreased by -38.84% as around 403,029 shares were sold when compared with its 50-day average volume of traded shares which is 658,970. At the moment, VCYT is witnessing a downtrend, as it is trading -6.1% below its 20-day SMA, 1.28% above its 50-day SMA, and 51.42% above its 200-day SMA. The company runs an ROE of roughly -42.8%, with financial analysts predicting that their earnings per share growth will be around 0% per annum for the next five year. This will be compared to the 12.7% increase witnessed over the past five years.

The first technical resistance point for Veracyte, Inc. (NASDAQ:VCYT) will likely come at $23.48, marking a 2.6% premium to the current level. The second resistance point is at $24.1, about 5.1% premium to its current market price. On the other hand, inability to breach the immediate hurdles can drag it down to $21.65, the lower end of the range. VCYT’s 14-day MACD is -0.73 and this negative figure indicates a downward trading trend. The company’s 14-day RSI (relative strength index) score is 45.27, which shows that its stock has been neutral. The 20-day historical volatility for the stock stands at 41.34 percent, which is low when compared to that of the 50-day’s 54.52 percent.

The shares of Navigant Consulting, Inc. (NYSE:NCI) has decreased by -1.51%, and now trading at $22.83 on the Wall Street in the intra-day deal, with their shares traded now around 515,423. This is a rise of 70,507 shares over the average 444,916 shares that were traded daily over the last three months. The stock that is trading at $22.83 went higher by 21.11% from its 52-week low of $18.85 that it attained back on 2019-03-25. The stock recorded a 52-week high of $27.4 nearly 75 days ago on 2019-02-15.

NCI stock has performed well over the past 30 days, as it added 17.26% while its price plunged by -5.07% year-to-date (YTD). Looking at the last few days, it has been good for the stock, as it rose 10.56% over the last week. The stock’s 12-month potential target price is now at $27.33. This means that the stock price might likely increase by 19.71% from its current trading price. 3 out of 4 Wall Street analysts which represents 75% rated the stock as a buy while the remaining 25% rated it as a hold, with 0% of analysts rating it as a sell.

Navigant Consulting, Inc. (NYSE:NCI) has been utilizing an ROE that is roughly 22%, with stock analysts predicting that the company’s EPS for the next five years will go up by 13.5% per year, following the -21.4% drop that was witnessed during the past five years. The stock at the moment is on a uptrend, trading 10.4% above its 20-day SMA, 8.57% above its 50-day SMA, and -0.31% below its 200-day SMA. In percentage terms, the aggregate Navigant Consulting, Inc. shares held by institutional investors is 0%. 31 institutions jumped in to acquire Navigant Consulting, Inc. (NCI) fresh stake, 88 added to their current holdings in these shares, 107 lowered their positions, and 34 left no stake in the company.

The stock’s 9-day MACD is 1.41 and this positive figure indicates an upward trading trend. The company’s 9-day RSI score is 76, which shows that its stock has been overbought. The 20-day historical volatility for the shares stand at 32.19 percent, which is less when compared to that of the 50-day’s 58.66 percent. On the daily chart, we see that the stock could reach the first level of resistance at $23.23, sporting a 1.72% premium to the current level. The next resistance point is at $23.62, representing nearly 3.34% premium to the current market price of Navigant Consulting, Inc. (NCI). On the other hand, failure to breach the immediate hurdles can drag it down to $22.28, the lower end of the range.

Stocks to Watch: Covetrus, Inc. (CVET) and Live Nation Entertainment, Inc. (LYV) in the spotlight

The price of Covetrus, Inc. (NASDAQ:CVET) went down by $-0.09 now trading at $32.87. The last few days have been rough for the stock, as its price has decreased by -0.51% during the week. It has also performed poorly over the past three months, as it lost around 0% while it has so far retreated around 0% during the course of a year. The stock of CVET recorded -21.74% downtrend from the beginning of this year till date. The 12-month potential price target for Covetrus, Inc. is set at $40.67. This target means that the stock has an upside potential to increase by 23.73% from the current trading price.

79 institutions entered new Covetrus, Inc. (NASDAQ:CVET) positions, 255 added to their existing positions in these shares, 291 lowered their positions, and 114 exited their positions entirely.

Covetrus, Inc. (CVET) trade volume has decreased by -17.7% as around 1,012,514 shares were sold when compared with its 50-day average volume of traded shares which is 1,230,236. At the moment, CVET is witnessing a uptrend, as it is trading 0.66% above its 20-day SMA, -3.64% below its 50-day SMA, and -5.93% below its 200-day SMA. The company runs an ROE of roughly 0%, with financial analysts predicting that their earnings per share growth will be around 15% per annum for the next five year. This will be compared to the 0% decrease witnessed over the past five years.

The first technical resistance point for Covetrus, Inc. (NASDAQ:CVET) will likely come at $33.09, marking a 0.66% premium to the current level. The second resistance point is at $33.31, about 1.32% premium to its current market price. On the other hand, inability to breach the immediate hurdles can drag it down to $32.45, the lower end of the range. CVET’s 14-day MACD is 0.2 and this positive figure indicates an upward trading trend. The company’s 14-day RSI (relative strength index) score is 45.81, which shows that its stock has been neutral. The 20-day historical volatility for the stock stands at 16.67 percent, which is low when compared to that of the 50-day’s 49.64 percent.

The shares of Live Nation Entertainment, Inc. (NYSE:LYV) has decreased by -0.95%, and now trading at $65.34 on the Wall Street in the intra-day deal, with their shares traded now around 1,540,231. This is a rise of 176,521 shares over the average 1,363,710 shares that were traded daily over the last three months. The stock that is trading at $65.34 went higher by 68.01% from its 52-week low of $38.89 that it attained back on 2018-05-01. The stock recorded a 52-week high of $66.8 nearly 2 days ago on 2019-04-29.

LYV stock has performed well over the past 30 days, as it added 2.83% while its price climbed by 32.67% year-to-date (YTD). Looking at the last few days, it has been tough for the stock, as it tumbled -1.63% over the last week. The stock’s 12-month potential target price is now at $65. This means that the stock price might likely increase by -0.52% from its current trading price. 9 out of 12 Wall Street analysts which represents 75% rated the stock as a buy while the remaining 25% rated it as a hold, with 0% of analysts rating it as a sell.

Live Nation Entertainment, Inc. (NYSE:LYV) has been utilizing an ROE that is roughly -1.5%, with stock analysts predicting that the company’s EPS for the next five years will go down by 0% per year, following the 17.8% raise that was witnessed during the past five years. The stock at the moment is on a uptrend, trading 0.82% above its 20-day SMA, 4.85% above its 50-day SMA, and 19.59% above its 200-day SMA. In percentage terms, the aggregate Live Nation Entertainment, Inc. shares held by institutional investors is 71.3%. 64 institutions jumped in to acquire Live Nation Entertainment, Inc. (LYV) fresh stake, 209 added to their current holdings in these shares, 176 lowered their positions, and 48 left no stake in the company.

The stock’s 9-day MACD is 0.2 and this positive figure indicates an upward trading trend. The company’s 9-day RSI score is 52.83, which shows that its stock has been neutral. The 20-day historical volatility for the shares stand at 14.35 percent, which is less when compared to that of the 50-day’s 22.81 percent. On the daily chart, we see that the stock could reach the first level of resistance at $66.22, sporting a 1.33% premium to the current level. The next resistance point is at $67.09, representing nearly 2.61% premium to the current market price of Live Nation Entertainment, Inc. (LYV). On the other hand, failure to breach the immediate hurdles can drag it down to $63.51, the lower end of the range.

Stocks to Watch: Alexco Resource Corp. (TSX:AXR) Down -2.76%

At close of market on Tuesday, Alexco Resource Corp. (TSX:AXR) stock finished trading at -2.76%, bringing the stock price to $1.41 on the Toronto Stock Exchange. The stock price saw a low of $1.38 and a high of $1.43.

The company’s stock was traded 433 times with a total of 81,314 shares traded.

Alexco Resource Corp. has a market cap of $155.79 million, with 110.49 million shares in issue.

Alexco Resource Corp and its subsidiaries are involved in mineral exploration and mine development business and also provide environmental consulting services which include management of the regulatory and environmental permitting process, remediation technologies, and project management services. The company has Environmental services and Mining operating segments. It derives the majority of its revenues from Environmental services segment. The firm’s projects include Keno hill project, Onek and Elsa Tailings development properties, Bermingham and Husky exploration properties.

STOCKS TO WATCH: EYES ON NEW SENIOR INVESTMENT GROUP INC. (SNR), BLACK KNIGHT, INC. (BKI)

The price of New Senior Investment Group Inc. (NYSE:SNR) went down by $-0.02 now trading at $5.59. Their shares witnessed a 38.37% increase from the 52-week low price of $4.04 they recorded on 2019-01-02. Even though it is still -55.46% behind the $8.69 high touched on 2018-05-01. The last few days have been good for the stock, as its price has grew by 4.49% during the week. It has also performed better over the past three months, as it added around 12.02% while it has so far retreated around -35.67% during the course of a year. The stock of SNR recorded 35.68% uptrend from the beginning of this year till date. The 12-month potential price target for New Senior Investment Group Inc. is set at $5.25. This target means that the stock has an upside potential to increase by -6.08% from the current trading price.

29 institutions entered new New Senior Investment Group Inc. (NYSE:SNR) positions, 70 added to their existing positions in these shares, 81 lowered their positions, and 24 exited their positions entirely.

New Senior Investment Group Inc. (SNR) trade volume has decreased by -29.23% as around 432,475 shares were sold when compared with its 50-day average volume of traded shares which is 611,114. At the moment, SNR is witnessing a uptrend, as it is trading 2.51% above its 20-day SMA, 5.26% above its 50-day SMA, and 0.17% above its 200-day SMA. The company runs an ROE of roughly -41.3%, with financial analysts predicting that their earnings per share growth will be around 0% per annum for the next five year. This will be compared to the -33.8% decrease witnessed over the past five years.

The first technical resistance point for New Senior Investment Group Inc. (NYSE:SNR) will likely come at $5.63, marking a 0.71% premium to the current level. The second resistance point is at $5.66, about 1.24% premium to its current market price. On the other hand, inability to breach the immediate hurdles can drag it down to $5.5, the lower end of the range. SNR’s 14-day MACD is 0.17 and this positive figure indicates an upward trading trend. The company’s 14-day RSI (relative strength index) score is 60.79, which shows that its stock has been neutral. The 20-day historical volatility for the stock stands at 25.35 percent, which is low when compared to that of the 50-day’s 27.64 percent.

The shares of Black Knight, Inc. (NYSE:BKI) has increased by 0.5%, and now trading at $56.42 on the Wall Street in the intra-day deal, with their shares traded now around 730,243. This is a rise of 14,847 shares over the average 715,396 shares that were traded daily over the last three months. The stock that is trading at $56.42 went higher by 33.38% from its 52-week low of $42.3 that it attained back on 2018-11-20. The stock recorded a 52-week high of $56.73 nearly 1 days ago on 2019-04-30.

BKI stock has performed well over the past 30 days, as it added 3.52% while its price climbed by 25.21% year-to-date (YTD). Looking at the last few days, it has been good for the stock, as it rose 1.07% over the last week. The stock’s 12-month potential target price is now at $58.88. This means that the stock price might likely increase by 4.36% from its current trading price. 13 out of 15 Wall Street analysts which represents 86.67% rated the stock as a buy while the remaining 13.33% rated it as a hold, with 0% of analysts rating it as a sell.

Black Knight, Inc. (NYSE:BKI) has been utilizing an ROE that is roughly 9.9%, with stock analysts predicting that the company’s EPS for the next five years will go up by 15.38% per year, following the 24.05% raise that was witnessed during the past five years. The stock at the moment is on a uptrend, trading 2.82% above its 20-day SMA, 5.47% above its 50-day SMA, and 11.38% above its 200-day SMA. In percentage terms, the aggregate Black Knight, Inc. shares held by institutional investors is 90.8%. 44 institutions jumped in to acquire Black Knight, Inc. (BKI) fresh stake, 143 added to their current holdings in these shares, 159 lowered their positions, and 55 left no stake in the company.

The stock’s 9-day MACD is 0.73 and this positive figure indicates an upward trading trend. The company’s 9-day RSI score is 71.48, which shows that its stock has been overbought. The 20-day historical volatility for the shares stand at 9.89 percent, which is more when compared to that of the 50-day’s 9.59 percent. On the daily chart, we see that the stock could reach the first level of resistance at $56.82, sporting a 0.7% premium to the current level. The next resistance point is at $57.21, representing nearly 1.38% premium to the current market price of Black Knight, Inc. (BKI). On the other hand, failure to breach the immediate hurdles can drag it down to $55.45, the lower end of the range.