Archives for April 30, 2019

Robotics Startup That Made Cute Toy Cozmo Shuts Down

A startup that tried to advance the dream of intelligent robots in the home with its toy robot Cozmo is shutting down.

SAN FRANCISCO — A startup that tried to advance the dream of intelligent robots in the home with its toy robot Cozmo is shutting down.

San Francisco-based Anki says it’s laying off its employees on Wednesday after failing to raise enough money to keep the business going.

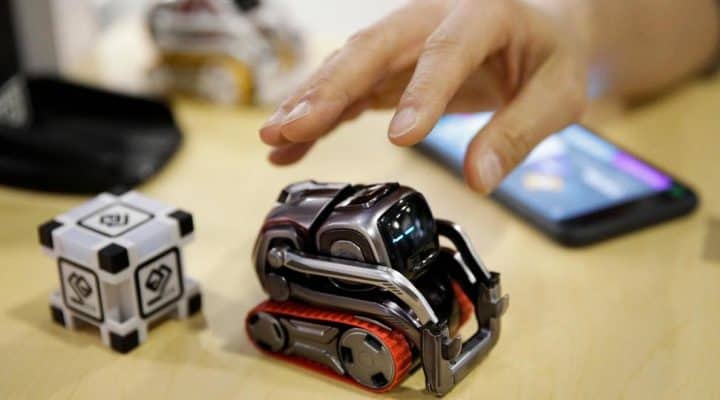
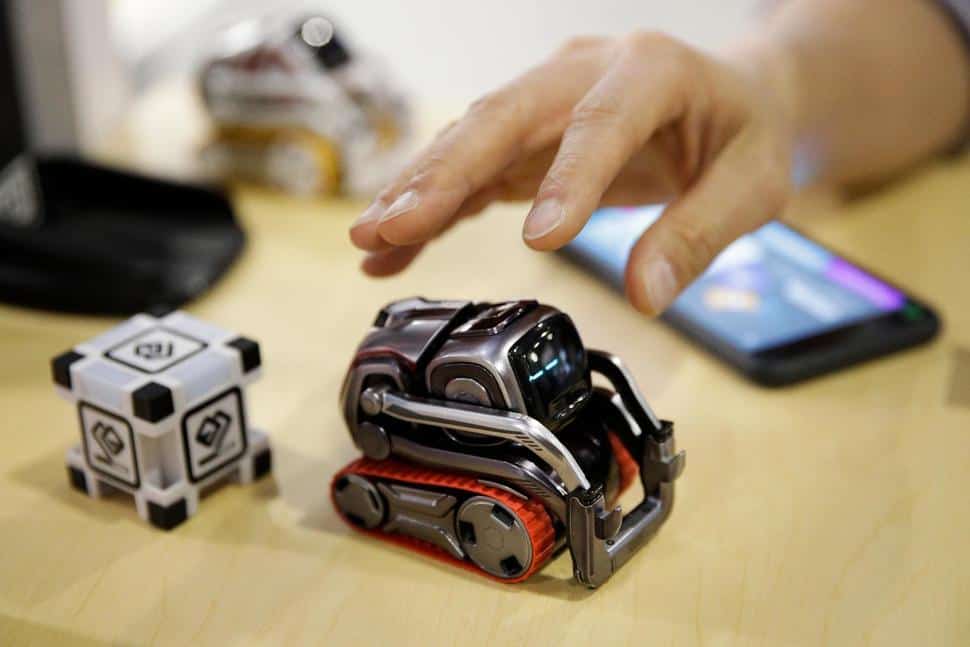
The company said last year it’s sold more than 1.5 million products, including the car-racing game Overdrive and Cozmo, a playful robotic pet. Anki introduced its newest robot, Vector, last year.

It’s one of several high-profile makers of consumer robots to fold in the past year. Boston-based Jibo shut down less than a year after its squat, talking speaker made the cover of Time Magazine. California-based Mayfield Robotics also last year canceled Kuri, a roving home robot.

News of Anki’s closure was first reported by Recode.

Jaguar Land Rover offers car owners crypto to share their driving data

Drivers can use their earnings to pay for coffee and parking.

Jaguar Land Rover drivers may soon be able to earn cryptocurrency for allowing their cars to transmit data about traffic, potholes and other metrics to the car maker and interested parties.

The smart wallet system is currently being trialled at Jaguar Land Rover’s new software hub in Shannon, Republic of Ireland, where models including the Jaguar F-PACE and Range Rover Velar have been configured to automatically report information about road conditions. If the system is implemented, drivers would have the option not to share this data, but the company is clearly hoping they will, given that they’re incentivising it with digital tokens.

The data wouldn’t just go to Jaguar Land Rover, either. The press release states that “owners earn credits by enabling their cars to automatically report useful road condition data such as traffic congestion or potholes to navigation providers or local authorities,” although how much granular control you’ll have over who does and doesn’t get the data is unclear.

The company is working with the IOTA Foundation to use its distributed ledger tech for the payments, which doesn’t charge a transaction fee and could thus be used to automatically pay for tolls, parking, coffee and anything else drivers might buy while in their cars. They’ll also be able to top up the total using normal money.

The crypto project forms part of Jaguar Land Rover’s ‘Destination Zero’ strategy, whereby the company aims to eventually reach zero emissions, accidents and congestion. To that end, the shared data would help to eliminate congestion and idle emissions by informing sat nav systems about areas to avoid, and also by using your car as a kind of giant credit card as you pass through toll gates.

Automatic tollbooth payment

The same strategy will see all Jaguar and Land Rover cars include an electric option by 2020.

Explaining the potential for the smart wallet system, Jaguar Land Rover Software Architect Russell Vickers comments, “In the future an autonomous car could drive itself to a charging station, recharge and pay, while its owner could choose to participate in the sharing economy – earning rewards from sharing useful data such as warning other cars of traffic jams.”

That all sounds fluffy and positive, but some groups will no doubt be concerned about the precedent for paying people to give up information. Facebook’s recent scheme to pay teenagers $20 for their smartphone data received huge amounts of backlash, for instance. Whether Jaguar Land Rover’s scheme will meet the same fate, or be more positively received given that traffic data is less personal, remains to be seen if the trial is successful.

However, the company would likely convince a lot more people to share with actual money rather than the promise of crypto.

Garmin’s fitness watches are getting period-tracking via an update

Users can now track their menstrual cycle, log symptoms, and more.

Garmin has added a feature for tracking menstrual cycles to its line of connected wearables and smartwatches. Women can now track their menstrual cycle and log symptoms through the Garmin Connect app. They can opt-in to receive reminders for periods and fertility windows on their Garmin smartwatches or wearables. With its new period tracker, Garmin joins other major fitness tracking apps such as Fitbit and Apple Health in giving their female users an option to track their reproductive health.

Garmin’s period tracking feature was developed by an all-female team, from engineers to marketing. “In this way, we could ensure we were authentically addressing a women’s actual wants and needs,” said Susan Lyman, Garmin’s vice president of global consumer marketing in a press release.

Technology has a dubious track record in addressing women’s “actual wants and needs” when it comes to their bodies. Fitness trackers have been late to the game in adopting features specifically designed for women’s health. While separate apps aimed at women’s menstrual cycles are almost as old as smartphones, they vary highly in quality and ease of use. Women who sought a comprehensive picture of their health all in one place — from their menstrual cycle, sleep and calories burned — didn’t have that many options until recently. Following complaints, Apple announced it would be adding a period tracking feature in 2015; an entire year after it debuted their HealthKit. Fitbit only launched a period tracking feature back in July, and its features are pretty lacking.

One notable perk of Garmin’s period tracker is that it will allow women to customize their cycles based on whether they’re regular, irregular or nearing menopause. Period apps are easily thrown off by irregular or short periods, but hopefully Garmin’s new period tracking feature will better accommodate this.

Energizer’s giant battery phone reached just 1 percent of its funding goal

Headlines do not equal sales.

Remember the comically enormous phone that Avenir Telecom showed off under the Energizer brand at this year’s Mobile World Congress? Its subsequent crowdfunding campaign has crashed and burned, as The Verge points out.

The P18K Pop, as the name suggests, had an 18,000mAh battery (for reference, a typical smartphone has 3,000mAh) and consequently was about the thickness of three iPhones.

The phone got lots of attention and headlines, but as has been proven time and again in tech, those don’t necessarily translate to sales. That lesson has come down on Avenir Telecom like a tonne of bricks (or brick-sized phones) now that the phone’s crowdfunding page, which ambitiously asked for £927,873 (about $1.2 million), has closed at just 1 percent of its target.

Avenir’s Indiegogo page attracted just 11 backers, who contributed a total of £11,602 (about $15,000). The campaign perks ranged from a single P18K handset at £425 ($549) to a three-pack at £1,227 ($1587).

The P18K Pop included a pop-up selfie camera (hence the ‘Pop’ in the name), which pleasingly made the handset look like an Energizer battery. It also packed a treble rear camera with depth sensor, Android 9.0 Pie and even an FM radio.

The crowdfunding campaign promised the phones would be delivered in October this year, but it appears that won’t be happening now. The huge target does suggest it was all a marketing stunt, however: it’s hard to believe the company truly believed they could raise over $1 million with a phone that wouldn’t fit in a clutch bag, never mind a pocket.

Still, the failure of the phone to raise anything more than eyebrows should be borne in mind next time a survey claims consumers want battery life above all else.

Stocks to Watch: Milestone Scientific Inc. (MLSS) and The9 Limited (NCTY) on the Marquee

The price of Milestone Scientific Inc. (NYSE:MLSS) went down by $-0.02 now trading at $0.42. Their shares witnessed a 61.54% increase from the 52-week low price of $0.26 they recorded on 2018-12-27. Even though it is still -161.9% behind the $1.1 high touched on 2018-05-29. The last few days have been good for the stock, as its price has grew by 5.82% during the week. It has also performed poorly over the past three months, as it lost around -12.3% while it has so far retreated around -46.58% during the course of a year. The stock of MLSS recorded 26.69% uptrend from the beginning of this year till date. The 12-month potential price target for Milestone Scientific Inc. is set at $1. This target means that the stock has an upside potential to increase by 138.1% from the current trading price.

2 institutions entered new Milestone Scientific Inc. (NYSE:MLSS) positions, 8 added to their existing positions in these shares, 2 lowered their positions, and 0 exited their positions entirely.

Milestone Scientific Inc. (MLSS) trade volume has decreased by -75.36% as around 53,948 shares were sold when compared with its 50-day average volume of traded shares which is 218,948. At the moment, MLSS is witnessing a uptrend, as it is trading 11.56% above its 20-day SMA, 14.63% above its 50-day SMA, and -22.8% above its 200-day SMA. The company runs an ROE of roughly -221.5%, with financial analysts predicting that their earnings per share growth will be around 0% per annum for the next five year. This will be compared to the -35.2% decrease witnessed over the past five years.

The first technical resistance point for Milestone Scientific Inc. (NYSE:MLSS) will likely come at $0.43, marking a 2.33% premium to the current level. The second resistance point is at $0.45, about 6.67% premium to its current market price. On the other hand, inability to breach the immediate hurdles can drag it down to $0.41, the lower end of the range. MLSS’s 14-day MACD is 0.05 and this positive figure indicates an upward trading trend. The company’s 14-day RSI (relative strength index) score is 58.08, which shows that its stock has been neutral. The 20-day historical volatility for the stock stands at 76.48 percent, which is high when compared to that of the 50-day’s 73.34 percent.

The shares of The9 Limited (NASDAQ:NCTY) has decreased by -2.86%, and now trading at $1.7 on the Wall Street in the intra-day deal, with their shares traded now around 89,026. This is a decline of -901,534 shares over the average 990,560 shares that were traded daily over the last three months. The stock that is trading at $1.7 went higher by 117.95% from its 52-week low of $0.78 that it attained back on 2018-12-27. The stock recorded a 52-week high of $8.13 nearly 193 days ago on 2018-10-19.

NCTY stock hasn’t performed well over the past 30 days, as it lost -17.07% while its price climbed by 65.05% year-to-date (YTD). Looking at the last few days, it has been tough for the stock, as it tumbled -2.3% over the last week. The stock’s 12-month potential target price is now at $3.5.

The9 Limited (NASDAQ:NCTY) has been utilizing an ROE that is roughly 27.1%, with stock analysts predicting that the company’s EPS for the next five years will go down by 0% per year, following the 24.2% raise that was witnessed during the past five years. The stock at the moment is on a downtrend, trading -10.53% below its 20-day SMA, -6.49% below its 50-day SMA, and 18.26% above its 200-day SMA. In percentage terms, the aggregate The9 Limited shares held by institutional investors is 0.04%. 3 institutions jumped in to acquire The9 Limited (NCTY) fresh stake, 3 added to their current holdings in these shares, 5 lowered their positions, and 4 left no stake in the company.

The stock’s 9-day MACD is 0.02 and this positive figure indicates an upward trading trend. The company’s 9-day RSI score is 39.83, which shows that its stock has been neutral. The 20-day historical volatility for the shares stand at 72.87 percent, which is less when compared to that of the 50-day’s 140.79 percent. On the daily chart, we see that the stock could reach the first level of resistance at $1.75, sporting a 2.86% premium to the current level. The next resistance point is at $1.81, representing nearly 6.08% premium to the current market price of The9 Limited (NCTY). On the other hand, failure to breach the immediate hurdles can drag it down to $1.61, the lower end of the range.

Stocks to Watch: Asanko Gold Inc. (AKG) and Libbey Inc. (LBY) on the Marquee

The price of Asanko Gold Inc. (NYSE:AKG) went down by $0 now trading at $0.63. Their shares witnessed a 12.5% increase from the 52-week low price of $0.56 they recorded on 2018-12-26. Even though it is still -119.05% behind the $1.38 high touched on 2018-05-09. The last few days have been good for the stock, as its price has grew by 1.29% during the week. It has also performed poorly over the past three months, as it lost around -12.39% while it has so far retreated around -43.93% during the course of a year. The stock of AKG recorded -1.66% downtrend from the beginning of this year till date. The 12-month potential price target for Asanko Gold Inc. is set at $1.26. This target means that the stock has an upside potential to increase by 100% from the current trading price.

5 institutions entered new Asanko Gold Inc. (NYSE:AKG) positions, 21 added to their existing positions in these shares, 14 lowered their positions, and 3 exited their positions entirely.

Asanko Gold Inc. (AKG) trade volume has decreased by -69.16% as around 80,796 shares were sold when compared with its 50-day average volume of traded shares which is 261,970. At the moment, AKG is witnessing a downtrend, as it is trading -1.63% below its 20-day SMA, -5.64% below its 50-day SMA, and -18.14% below its 200-day SMA. The company runs an ROE of roughly -41.5%, with financial analysts predicting that their earnings per share growth will be around 0% per annum for the next five year. This will be compared to the 0% decrease witnessed over the past five years.

The first technical resistance point for Asanko Gold Inc. (NYSE:AKG) will likely come at $0.64, marking a 1.56% premium to the current level. The second resistance point is at $0.65, about 3.08% premium to its current market price. On the other hand, inability to breach the immediate hurdles can drag it down to $0.61, the lower end of the range. AKG’s 14-day MACD is -0.01 and this negative figure indicates a downward trading trend. The company’s 14-day RSI (relative strength index) score is 44.76, which shows that its stock has been neutral. The 20-day historical volatility for the stock stands at 34.74 percent, which is low when compared to that of the 50-day’s 35.62 percent.

The shares of Libbey Inc. (NYSE:LBY) has increased by 8.68%, and now trading at $2.88 on the Wall Street in the intra-day deal, with their shares traded now around 231,188. This is a decline of -84,810 shares over the average 315,998 shares that were traded daily over the last three months. The stock that is trading at $2.88 went higher by 17.55% from its 52-week low of $2.45 that it attained back on 2019-04-17. The stock recorded a 52-week high of $11.54 nearly 271 days ago on 2018-08-02.

LBY stock hasn’t performed well over the past 30 days, as it lost -4% while its price plunged by -25.77% year-to-date (YTD). Looking at the last few days, it has been good for the stock, as it rose 6.67% over the last week. The stock’s 12-month potential target price is now at $6.5. This means that the stock price might likely increase by 125.69% from its current trading price. 1 out of 2 Wall Street analysts which represents 50% rated the stock as a buy while the remaining 50% rated it as a hold, with 0% of analysts rating it as a sell.

Libbey Inc. (NYSE:LBY) has been utilizing an ROE that is roughly -12.8%, with stock analysts predicting that the company’s EPS for the next five years will go up by 10% per year, following the -17.9% drop that was witnessed during the past five years. The stock at the moment is on a uptrend, trading 5.49% above its 20-day SMA, -13.54% below its 50-day SMA, and -54.01% below its 200-day SMA. In percentage terms, the aggregate Libbey Inc. shares held by institutional investors is 79%. 9 institutions jumped in to acquire Libbey Inc. (LBY) fresh stake, 32 added to their current holdings in these shares, 43 lowered their positions, and 13 left no stake in the company.

The stock’s 9-day MACD is 0.06 and this positive figure indicates an upward trading trend. The company’s 9-day RSI score is 59.65, which shows that its stock has been neutral. The 20-day historical volatility for the shares stand at 57.4 percent, which is less when compared to that of the 50-day’s 132.51 percent. On the daily chart, we see that the stock could reach the first level of resistance at $2.99, sporting a 3.68% premium to the current level. The next resistance point is at $3.09, representing nearly 6.8% premium to the current market price of Libbey Inc. (LBY). On the other hand, failure to breach the immediate hurdles can drag it down to $2.51, the lower end of the range.