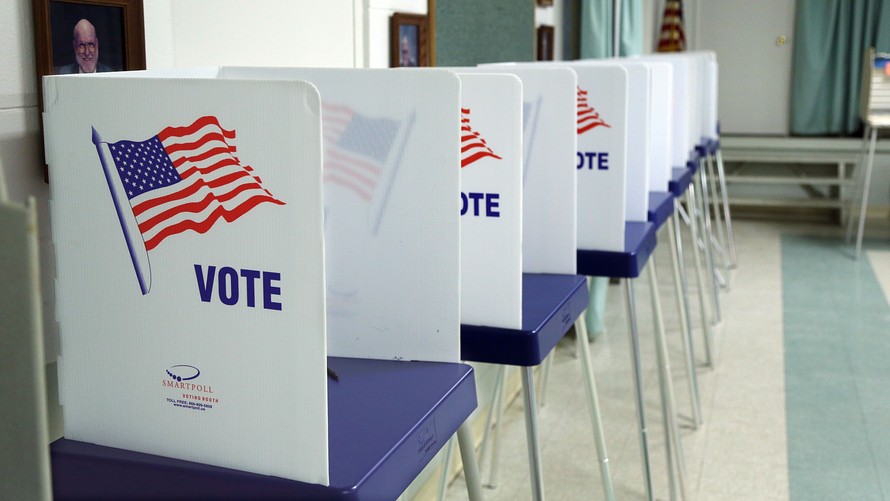
With the midterm elections less than two months away, U.S. stock-market investors are increasingly paying attention to the upcoming vote, viewing it as a potential turning point for the political environment and, with it, the market’s prospects.
The vote will be held on Nov. 6, and comes at a time of unusually high political uncertainty, particularly surrounding such key economic issues as trade and taxes.
Control of both houses of Congress is at stake. Currently, the Democratic Party is largely favored to take control of the House of Representatives, though they’re seen as having a harder hurdle to flip the Senate from Republican control. The Wells Fargo Investment Institute calculated a 50% chance of a divided government, and only a 20% chance that the Democrats retake both houses.
Uncertainty over which party controls each chamber, as well as what the political makeup would mean for market-relevant legislation, is likely to spur volatility going into the vote. However, history suggests that investors should expect strong performance afterward, once the uncertainty passes and investors are able to analyze what the new political environment might mean for equities.
According to the Wells Fargo Investment Institute, the S&P 500 sees an average pullback of nearly 19% in midterm-election years, based on data going back to 1962 (or 14 midterm cycles). In the year after the midterm, however, the S&P climbs more than 31%, on average.
“It does not matter which party was in charge before or after the midterm election. The removal of uncertainty and of constant media attention allows markets to resume focusing on fundamentals,” wrote Craig Holke, an investment strategy analyst at the Institute.
Other analysts have expressed more caution about the impact the midterms could have. Société Générale recently said that a change in the ruling party of either house “could have serious market and economic consequences, such as potentially more frequent government shutdowns, impeachment considerations and general uncertainty.”
Separately, the Goldman Sachs Investment Strategy Group wrote that stocks—particularly small-capitalization stocks RUT, +0.05% —tend to bigger annualized gains in periods of united governments, where one party controls the White House and the two branches of the legislature.
According to the firm’s data, small stocks see gains of 9.5% in periods of divided government, less than half the 21.8% annualized gain it sees in periods of united government. For large-cap equities, as measured by the S&P 500, stocks see annualized gains of 10.8% in periods of a divided government, compared with gains of 16.4% during united governments.
So far this year, the S&P SPX, +0.37% is up 8%, while the Dow Jones Industrial Average DJIA, +0.44% has risen 5.2% and the Nasdaq Composite Index COMP, +0.61% has gained more than 15%. Earlier this year, however, the indexes underwent a sharp decline, with the S&P dropping into correction territory, defined as a drop of at least 10% from a peak. It subsequently rebounded to exit correction territory, and is currently less than 1% below record levels.


