
Investors who want to sport market-beating returns must first learn a few valuable skills and be willing to put in a little weekend homework. Arguably, the single most important skill investors can learn is how to value a stock. Without this proficiency, investors are left dancing in the market’s winds without a firm foundation, not knowing if a company’s future growth projections are already baked into the stock price or if a company’s shares are severely undervalued. The very thought makes me shudder!
Almost everything in the financial news media can be classified as unnecessary background noise, but investors must have a way of determining a stock’s true intrinsic value. For that reason, let’s take a closer look at a few tools investors have historically used to value stocks and how you can use them to discover undervalued stocks today. But first…

Determining a stock’s intrinsic value, a wholly separate thing from its current market price is one of the most important skills an investor can learn. Image source: Getty Images.
What is a stock?
Before discussing how to determine the intrinsic value of stock and whether it’s under- or over-valued, let’s first review what a stock is. It is not a piece of paper nor is it a ticker symbol displayed next to some numbers on a screen. A single share of a company represents a small, but real, ownership stake in a corporation. One stock’s percentage of ownership is determined by dividing it by the total number of shares outstanding. While there are different types of stocks, stock ownership generally entitles the owner to corporate voting rights and to any dividends paid.
Why value stocks?
Before purchasing these fractional ownership stakes to a particular company, it is important to understand that the stock’s intrinsic value is not necessarily directly tied to its current market price, though some would have you believe it is. In fact, there are many who buy into the efficient market hypothesis, a theory that states that all known information is currently priced into a stock. The implication of this theory is that beating the market is almost purely a matter of chance and not one of expert stock selection.
Most adherents of this theory simply suggest investing into an index fund or ETF because of the seemingly impossible task of beating the market. While it is hard to argue with the advice — after all, passively investing into an index fund gives investors instant diversification in multiple stocks for low fees and immediate access to the stock market’s historic returns — it also doesn’t take too long to see the holes in the theory.
For starters, how does the efficient market hypothesis take into account historic stock market bubbles? On October 19, 1987, the Dow Jones Industrial Average dropped a staggering 508 points, or roughly 23% of its value, in just one trading session. Over the course of two trading days in October 1929, the Dow Jones lost about a quarter of its value. If the efficient market hypothesis were true, one would be hard-pressed to explain how the market could lose 25% in one day unless it was extremely over-valued before the crash or severely undervalued after the drop.
Rather, active investors believe the market swings between euphoria and pessimism on a fairly regular basis. The father of value investing, Benjamin Graham, emphasized this aspect of the stock market, believing it regularly overvalued and undervalued shares in publicly traded companies. In his classic investing book, The Intelligent Investor, Graham wrote:
Imagine that in some private business you own a small share that cost you $1,000. One of your partners, named Mr. Market, is very obliging indeed. Every day he tells you what he thinks your interest is worth and furthermore offers either to buy you out or to sell you an additional interest on that basis. Sometimes his idea of value appears plausible and justified by business developments and prospects as you know them. Often, on the other hand, Mr. Market lets his enthusiasm or his fears run away with him, and the value he proposes seems to you a little short of silly.
Active investors believe a stock’s value is wholly separate from its market price. Investors use a series of metrics, simple calculations, and qualitative analysis of a company’s business model to determine its intrinsic value, then determine whether it is worth an investment at its current price. Let’s take a closer look at the tools investors use to value a stock.
The cornerstone to valuing stocks: The P/E ratio
The go-to metric for nearly all investors when it comes to valuing a stock has to be the P/E ratio. Standing for price-to-earnings, this formula is calculated by dividing the stock price by the earnings per share (EPS). The lower the P/E ratio, the more earnings power investors are buying with each share or, put another way, the less time it takes for a stock to pay investors back in earnings.
For a quick example, let’s calculate the P/E ratio of Walmart (NYSE: WMT). For the 2017 fiscal year, the company reported diluted earnings per share of $3.28. As I write, the price of the company’s shares is $86.84. To obtain the P/E ratio we simply divide the stock price by the EPS:
86.84/3.28 = 26.48
Easy peasy, right? Well, not exactly…
Using GAAP vs. adjusted earnings to determine the P/E ratio
Walmart’s shares are currently valued at a P/E ratio of 26.48. This is the number (or something close to it) found on most financial websites at the time of writing, but is it the most accurate? This P/E ratio was calculated using GAAP (generally accepted accounting principles) earnings.
GAAP is a set of universal standards for public companies to follow when reporting their earnings. While the GAAP rules were given so that a universal standard exists to keep some companies from hiding the company’s performance from investors, the truth is they do not always show an accurate snapshot of how a business is performing.
There are plenty of reasons why the GAAP earnings might not present a true picture of a particular company’s business. Perhaps the company sold off a struggling division and now has to count the proceeds as earnings in the quarter, making it look like the earnings jumped. Or maybe the company recorded a huge tax benefit that will cause earnings to temporarily spike.
For this reason, most companies (but not all) also present adjusted or non-GAAP earnings in an attempt to more honestly report how the business is performing. Looking at Walmart, we see this is the case for it as well. In the company’s fourth-quarter earnings report (always available on a company’s investor relations site), Walmart reported a full-year adjusted EPS of $4.42. When companies report adjusted numbers, they almost always provide reconciliations for the GAAP vs. non-GAAP numbers. In Walmart’s case (see page 12 of its fourth-quarter earnings report), we see the adjusted EPS is arrived by including things like a loss on the extinguishment of debt, an employee lump sum bonus, restructuring fees, and a few other miscellaneous charges. Using the adjusted EPS, we find Walmart’s P/E ratio much more palatable:
86.84/4.42 = 19.65
For the reasons stated above, I almost always use adjusted earnings numbers for calculating P/E ratios though it is wise to see how the numbers are reconciled before taking any number the management gives you on faith.
What’s a good P/E ratio to buy a stock at?
Unfortunately, there’s no P/E ratio set in stone that makes a stock a buy if it’s below, or a sell if it’s above. There’s no Mendoza line in investing! Often value investors and growth investors will look for different things in a P/E ratio. The greater the difference between the stock’s intrinsic value and its current price, also known as the margin of safety, the more likely a value investor will consider the stock a worthy investment. For value investors, generally speaking, the lower the P/E ratio the better.
Growth investors, on the other hand, are probably not too interested in buying stocks with low P/E ratios because it is extremely unlikely to find stocks with those types of numbers and the high growth rates they seek. Growth investors are much more likely to buy stocks with higher P/E ratios, believing the superior earnings growth more than justifies the higher cost.
How growth investors can use variations of the P/E ratio
Growth investors often use the P/E ratio as a building block for finding two other metrics: the forward P/E and the PEG ratios.
The forward P/E is easy enough to find once you know how to solve for the P/E ratio. The forward P/E ratio is the exact same equation with one substitute: Instead of using the EPS from the trailing twelve months, we use the projected EPS the company is expected to produce over the next fiscal year. In other words, the formula is calculated by dividing the stock price by the company’s expected future earnings. Personally, I prefer to use the company’s guidance if it provides these figures, but others prefer to use analyst estimates.
The PEG ratio is calculated by dividing the company’s P/E ratio by its expected earnings growth. This formula can be played with a bit, as investors can plug earnings growth over different time periods into the equation but, generally speaking, most investors use a projected five-year growth rate for EPS. While this formula is a great tool for measuring companies’ P/E ratios relative to their expected earnings growth, five years is a long time. A lot of assumptions are built into that formula that might not come to pass.
Let’s continue with our Walmart example. We have already determined that using Walmart’s adjusted earnings, it currently trades at a P/E ratio of 19.65. In the company’s same fourth-quarter earnings report, it provided EPS guidance for its fiscal 2019 fiscal year of $4.75 to $5.00. When a company provides a range, I like to split the difference, so I would use a midpoint of $4.87 to solve for the company’s forward P/E. With $4.87 as our guidepost, we have:
86.84/4.87 = 17.83
This lets us know that at its current stock price today, this is what Walmart’s P/E ratio would be a year from now. If Walmart meets the midpoint of its guidance, that represents earnings growth of 10.2% over the next year. If we needed to calculate Walmart’s PEG ratio using its one-year earnings growth projections, it would be the company’s current P/E ratio divided by its expected earnings growth:
19.65/10.2 = 1.93
While, again, there is no clear buy or sell signal based on a particular figure, generally speaking, a stock with a PEG ratio below 1.0 is considered an exceptional value for the growth rate it is expected to show.
Other valuation metrics
While using the P/E ratio as a building block is probably the most popular method to value stocks it is far from the only way. Another common technique to valuing stocks is the price/sales ratio. The P/S ratio is determined by dividing a company’s market cap — the total value of all the companies outstanding shares — by its annual revenue. Because this ratio is based on revenue, not earnings, it is widely used to evaluate public companies that are not yet profitable and rarely used on stalwarts with consistent earnings such as Walmart. However, because of Amazon’s inconsistent earnings growth, it would probably be one of the preferred metrics to use to evaluate the online retailer.
Using Amazon’s market cap of $725.7 billion and the company’s 2017 fiscal year revenue of $177.9 billion, Amazon’s P/S ratio is found by:
725.7/177.9 = 4.08
Again, there is no magical answer to the P/S ratio that tells us if a stock is a buy or sell. In fact, by itself, the P/S ratio does not tell us much at all. It is also not entirely useful to compare P/S ratios of stocks from different sectors. Consider: If a big box retailer has margins of 5%, you would expect its P/S ratio to be lower than a software company’s P/S ratio with margins of 50%. What a P/S ratio is useful for is comparing ratios of companies with similar business models. For Walmart, that might mean comparing its P/S ratio with Target Corporation’s P/S ratio. with
Another metric useful for evaluating some types of stocks is the price-to-book ratio. A company’s book value is equal to a company’s assets minus its liabilities (found on the company’s balance sheet). The book value per share is determined by dividing the book value by the number of outstanding shares for a company. Finally, to solve for the ratio, divide the share price by the book value per share.
Assets-Liabilities = Book value
Book value/Outstanding shares = Book value per share
Share price/book value per share = Price-to-book ratio
Admittedly, this is a much more complicated process than the ratios mentioned above and is not too useful for asset-lite business models, like software tech companies. It is useful when evaluating banks and other financial institutions that carry a number of assets on their balance sheets. For investors, it’s just another tool in the toolbox that can be useful when evaluating certain types of companies.
It’s a trap!
A value trap is a stock that appears to be cheap but, in reality, is not because of deteriorating business conditions. Examples of traps include pharmaceutical companies with a valuable patent set to expire, cyclical stocks at the peak of the cycle, or tech stocks in the midst of having their expertise being commoditized away. Unfortunately, this is a pitfall I have firsthand experience with. In early 2016, I bought shares of Gilead Sciences, Inc. (NASDAQ: GILD) for just under $93. At the time, Gilead’s trailing twelve months EPS was $11.74 giving it what I thought was a dirt cheap P/E ratio of 7.9 — I thought shares were a steal.
While I knew new competition to its Hepatitis treatments were entering the market, I thought there was more than enough market share to go around and that the margin of safety was great enough to make it a worthwhile investment. If you’re familiar with the stock, you know what happened next.
I vastly underestimated the competition’s effect on Gilead’s market share and overestimated Gilead’s pipeline for new drugs. Gilead’s 2017 adjusted EPS was a mere $8.84, a 25% decline from when I bought my shares in early 2016. The share price has followed suit and now sits at $73.70, a 20% decrease since I purchased them. To add insult to injury, I bought my shares during a substantial market dip so, while Gilead has declined the market has exploded upward since my ill-timed purchase:
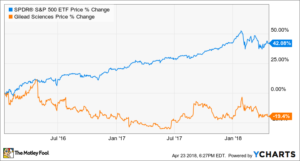
That’s right, Gilead has underperformed the market by about 60% since my purchase. While I sold my shares about a year after my purchase once I realized my mistake, it not only came at a realized loss but also cost me a golden opportunity to capitalize on some discounts to some of my favorite stocks. Ouch! This is why it’s so important to not only do some quick and dirty computation before you buy a stock but also to evaluate the quality of the business you’re buying.
Final thoughts on valuing a stock
There’s more to valuing a stock than just crunching numbers. Investors have to take into careful consideration qualitative factors also, such as a company’s economic moat. Moats encompass companies’ competitive advantages, such as a network effect, cost advantages, high switching costs, or intangible assets (e.g. patent, regulations, or brand recognition). Quality should be carefully considered when looking at a company’s value. As Warren Buffett famously said, “It’s far better to buy a wonderful company at a fair price than a fair company at a wonderful price.”
That being said, it’s imperative investors understand how to find a company’s intrinsic value apart from its current share price. Having the aforementioned tools in their tool belt will help anyone looking to value stocks and companies while investing.