Stock Markets
Equities remained volatile in light-volume summer trading. Anticipation over the release of the important inflation data appeared to have kept investors out of the market, but inflation came in higher than expected. The higher-than-expected consumer prices for June pushed consumer inflation to 9.1%, higher than the expected 8.8%, resulting in a new 41-year high. Consumer prices jumped 1.3% in June alone accounted for by the surge in gas prices by 11.2% for the same month. The week also saw the release of the first major second-quarter corporate earnings reports. The S&P 500 descended to its lowest intraday level since June 22 on Thursday morning, but Friday saw it rallying to end the week well off its lows. Among the best performers in the Index were technology stocks mainly due to solid gains in Apple. The energy sector underperformed weighed down by the plunge of international oil prices to levels last seen before the Russian invasion of Ukraine.
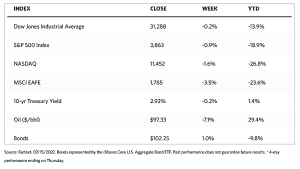
For the week, nearly all sectors are down in the S&P 500 Index, which itself dipped 0.93%. The Dow Jones Industrial Average inched down 0.16%, while the Nasdaq Composite, which tracks technology stocks, slipped south by 1.57%. The NYSE Composite was also down 1.32%. The Dow Jones total stock market index dropped by 1.07%.
U.S. Economy
This week and likely for the next few weeks at least, high energy and food prices will continue to drive the story for the markets. The 9.1% CPI reading from a year ago is up from the May CPI indicator of 8.6%. Energy prizes alone rose 42% year-over-year and were up 7.5% from May. The rise in oil prices accounted for more than half of the overall increase in inflation. It is likewise concerning to note that food prices experienced their highest monthly increase since 1981. That being said, commodity prices have fallen sharply since June. Last week, as noted by the energy sector performance, oil prices decline to their lowest level since the advent of the Ukrainian invasion. It briefly traded at $91 before ending the week at $98. In mid-June, gasoline prices were well over $5 a gallon. Since then, it has dropped off to an average of $4.58. The core CPI indicator, which better represents the underlying inflationary trend because it excludes food and energy prices, rose at 5.9% over the past year, down only slightly from the 6.0% reported over the past month. The Federal Reserve is under pressure to continue to hike interest rates as a result of the higher-than-expected inflation reading, heightening fears of an impending recession.
Metals and Mining
Several gold investors are wondering why gold prices have dropped for the last five straight weeks, despite the surge in the inflation rate and a situation where the world is on the brink of a recession. There is one simple reason for gold’s slump. The market is anticipating that the Federal Reserve will maintain its stance to bring inflation under control. This explains why gold prices have fallen more than $100 this week, depreciating nearly 6% and looking to test the critical long-term support level at $1,700. The Fed is expected to continue to aggressively raise interest rates in an attempt to slow inflation and, subsequently, the demand for consumer goods, thus slowing the economy. The Fed’s stance is driving real yields higher even while consumer prices rise to a 40-year high. Gold is a traditional inflation hedge, but investors do not need a hedge if inflation comes under control. Gold may be down, but it is certainly not out. With a recession possibly on the horizon, gold may well find new buying incentives if investors begin to doubt the Fed’s credibility and commitment to inflation control should economic growth begin to falter.
Precious metals are down this week. Gold fell further from its prior week’s close at $1,742.48 to $1,708.17 per troy ounce, down by 1.97%. Silver is also down from its previous close at $19.32 to this week’s close at $18.71 per troy ounce, a loss of 3.16%. Platinum gave up 4.86% of its value one week before at $894.76 to this week’s $851.31 per troy ounce. Palladium is also down by 15.30%, from the prior week’s $2,160.96 to this week’s $1,830.37 per troy ounce. The 3-month prices of base metals did not fare better. Copper, previously at $7,805.50, closed this week at $7,190.50 per metric tonne, down by 7.88%. Zinc came from $3,099.00 and ended at $2,915.00 per metric tonne for a loss of 5.94%. Aluminum slipped from its previous weekend price of $2,436.50 to this week’s close at $2,343.00 per metric tonne, down by 3.84%. Tin went down by 2.03% from the earlier week’s $25,364.00 to $24,850.00 per metric tonne.
Energy and Oil
The oil market observers have become watchers of the world macroeconomy as the price swings of oil became increasingly dependent on the broader market sentiment. This week just ended was in most part influenced by the market anticipating a 100-basis-point hike, thus sending all global crude oil benchmark prices plunging by double digits. However, when the U.S. Federal Reserve instead decided to hike interest rates by only a modest 75 basis points, ICE Brent quickly recovered back to $102 per barrel. It seems there is still no consensus on the main driving trend in the markets after the recent hedge fund sell-off. The fears that an economic recession may materialize remain pronounced and just as strong as the sentiment of immediate physical tightness. Despite the present visit by the American President to Saudi Arabia, senior U.S. officials admit that they do not expect Riyadh to immediately boost crude production, thus lifting crude prices by $2 per barrel in Friday’s trading.
Natural Gas
For the report week beginning July 6 and ending July 13, 2022, natural gas prices generally moved sideways on listless trading, The Henry Hub spot price rose from $5.63 per million British thermal units (MMBtu) to $6.63/MMBtu, a week-on-week increase of $1. Regarding futures prices, the price of the August 2022 NYMEX contract rose $1.179, from $5.510/MMBtu to $6.689/MMBtu throughout the week. The price of the 12-month strip averaging August 2022 through July 2023 futures contracts ascended $0.812 to $5.834/MMBtu. At most locations during this report week natural gas spot prices rose. Increases ranged from $0.77 at Eastern Gas south in the Appalachia production region to $2.26 at SoCal Citygate in Southern California. In the domestic market, the average total supply of natural gas fell by 0.1% compared with the previous report week. Dry natural gas production decreased by 0.5% compared with the previous week. Total U.S. consumption of natural gas rose by 2.5% compared with the previous report week. Natural gas consumed for power generation increased by 5.0% week over week. U.S. LNG exports increased by four vessels this week compared to last week.
World Markets
In Europe, equities markets moved sideways to slightly lower. Central banks further hiked interest rates, raising concerns that a global recession may indeed materialize. During the five trading days ending on July 15, the pan-European STOXX Europe 600 Index closed 0.80% lower in local currency terms. Italy’s FTSE MIB lost 3.86%, Germany’s DAX dropped 1.16%, and France’s CAC 40 gained a marginal 0.05%. the UK’s FTSE 100 Index slid 0.52% down. Core eurozone bond yields fell due to worries that a cutoff of Russian gas might push European economies into a recession. As a result, markets tempered their expectations for policy tightening, causing core bonds to rally. UK government bond yields followed core markets and peripheral eurozone bond yields ended broadly level. Italian 10-year bond yields broadly tracked core bonds earlier in the week, but sold off after Italy’s ruling coalition collapsed. The euro broke below parity with the U.S. dollar for the first time in 20 years due to fears of a recession intensifying.
The stock markets in Japan rose for the week, with the Nikkei 225 Index climbing 1.02% and the broader TOPIX Index closing 0.27% higher. Japan mourned the passing of its former and longest-standing prime minister, Shinzo Abe, who was shot and killed on July 8 while campaigning for the parliamentary upper house election. World leaders offered their condolences. On July 10, the ruling Liberal Democratic Party (LDP) increased its seat count in the election. It won a majority with its coalition partner Komeito, signaling strong support for Prime Minister Fumio Kishida of the LDP. This also strengthened the government’s policy priorities, and its focus on lifting growth will likely remain unchanged. The Bank of Japan (BoJ) reiterated its commitment to the ultra-loose monetary policy it had been pursuing. The yield on the 10-year Japanese government bond dipped to 0.23% from last week’s 0.24%. The yen weakened to JPY138.8 against the U.S. dollar from last week’s JPY 136.1, after hitting a fresh 24-year low during the week.
China’s stock markets consolidated as data showed that the country’s economy slowed dramatically in the second quarter. Also, property and banking shares were hurt by a growing movement among homebuyers to stop paying their mortgages. The broad, capitalization-weighted Shanghai Composite Index declined by 3.8%, while the blue-chip CSI 300 Index, which tracks the largest listed companies in Shanghai and Shenzhen, plunged by 4.1%. The country’s GDP for the second quarter grew at a worse-than-expected rate. It registered 0.4% from one year earlier, compared to the 4.8% expansion in the first quarter. Friday’s GDP followed reports of a rapidly growing number of Chinese homebuyers who refused to pay mortgages for unfinished construction projects. As of Wednesday, homebuyers have halted mortgage payments on at least 100 projects in more than 50 cities across the country as of Wednesday, a sharp increase from just a few days earlier. Among other economic data, Industrial production grew 3.9% in June from one year earlier, up from May’s 0.7% increase, while fixed asset investment increased 6.1% in the first six months of the year from comparative figures last year. Retail sales surged 3.1% year-on-year in June, beating analysts’ expectation of flat growth after May’s 6.7% drop.
The Week Ahead
The important economic data scheduled for release in the coming week include building permits on Tuesday and the LEI index on Thursday.
Key Topics to Watch
- NAHB home builders’ index
- Building permits (SAAR)
- Housing starts (SAAR)
- Existing home sales (SAAR)
- Initial jobless claims
- Continuing jobless claims
- Philadelphia Fed manufacturing index
- Leading economic indicators
- S&P Global U.S. manufacturing PMI (flash)
- S&P Global U.S. services PMI (flash)
Markets Index Wrap Up