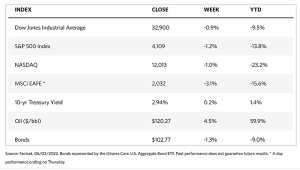
Stock Markets
Part of the previous week’s strong gains was given up during this week’s trading, despite being only a four-day trade week due to Monday being Memorial Day. Investors continue to remain uncertain as to whether the Federal Reserve will be able to rein in inflation without pushing the economy into a full-blown recession. The industrial sector outperformed the rest of the market-driven by a rise in Boeing. Furthermore, gains in Amazon shares boosted consumer discretionary shares which also proved resilient. Volatility proceeded moderately as expected, although analysts expect the economy to become progressively destabilized by the rising interest rates and elevated commodity prices. On Friday, Elon Musk emailed his fellow executives that 10% of Tesla’s workforce may be laid off and that he had a “super bad feeling” about the global economy.
U.S. Economy
The economic news released during the week did not particularly signal that the economy would be headed towards a worsening employment situation marked by layoffs. A report issued by the Labor Department last Friday indicated that employers added 390,000 nonfarm jobs in May, exceeding consensus expectations of 320,000. Weekly jobless claims reported on Thursday were slightly lower than expected, even as April job openings registered 11.4 million, only slightly below record highs. The unemployment rate holds steady at 3.6%, the best rate since the pandemic began and just marginally above the lowest rate for the last half-century. That being said, the Conference Board’s index of consumer confidence slid lower in May, reflecting the lessening enthusiasm workers felt about their job prospects. Modestly more Americans said that jobs were “hard to get.”
While the economy appears to be slowing due to ongoing inflation, rising consumer prices, supply-chain bottlenecks, and tightening financial conditions, it is far teetering on the edges of a recession. The wage situation, in line with the jobs market and employment rate, shows that average hourly earnings were up 5.2% over the year before, suggesting that: (1) wage growth remains sufficiently robust and is expected to support household income and spending, which in turn will drive further economic expansion, and (2) wage growth will continue to support ongoing inflation, which the Fed is expected to meet with additional rate hikes. While the labor market situation is not exactly sounding the alarm, it appears that there is little room for further improvement from this point onwards. Economic and corporate-earnings growth may continue and market fundamentals still provide some impetus for gains, but until there is greater confidence in the market the prospects are still uncertain about a durable rebound in the near future.
Metals and Mining
The price of gold treaded a sideways path this week as prices varied little beyond the $1,850 per ounce range. There appears to be a swell building, however, as physical demand saw an extraordinary rise in May. According to the U.S. Mint, it sold 147,000 ounces of gold, its best May performance going back to 2010. Gold bullion is up 400% from its five-year average between 2015 and 2019, thus the sudden demand does not appear attributable to any covid-19 market disruptions. Analysts have also noted that there is a delinking between the physical demand and the paper market for gold. There is a distortion created by the capping of gold futures prices as a result of rising bond yields and the stronger U.S. dollar caused by the Federal Reserve’s aggressively raising interest rates. A better picture of investor sentiment and anxiety in the precious metals market is reflected in the physical gold market.
The spot price for gold rose from $1,853.72 to $1,851.19 per troy ounce during this trading week, a slight loss of 0.14%. Silver slid 0.81% down from the previous week’s $22.11 to this week’s close of $21.93 per troy ounce. Platinum rose from $958.13 to $1,017.73 per troy ounce for a week-on-week gain of 6.22%. Palladium dipped from the prior week’s ending price of $2,067.44 to this week’s close at $1,982.74 per troy ounce, a loss of 4.10%. The 3-mo prices of base metals likewise exhibited listless trading. Copper began at $9,459.00 and ended at $9,499.50 per metric tonne, inching upward by 0.43%. Zinc closed the previous week at $3,843.50 and closed this week at $3,864.50 per metric tonne for a gain of 0.55%. Aluminum lost 5.07% from the earlier week’s close at $2,871.50 to this week’s close at $2,726.00 per metric tonne. Tin gained 2.41% from the prior week’s price at $34,106.00 to this week’s ending price at $34,929.00 per metric tonne.
Energy and Oil
The oil markets went through a roller coaster ride this week as turmoil governed the major suppliers of fossil fuels. China is emerging from its three-month pandemic lockdown, creating a scenario for dramatically increasing demand. Reports also revealed that Saudi Arabia and the UAE are poised to accelerate the monthly increments of OPEC+. The oil group opted for 648,000 barred-per-day increases in July and August to bring the final unwinding of its production cuts forward by one month on fears that Russian production may be falling. The move sent hopes up that prices may indeed be on their way down closer to $110 per barrel.
Unfortunately for those looking forward to lower prices, the news was released that U.S. inventories were dropping at the same time the European Union (EU) decided to ban Russian oil imports. This arrested the downtrend and sent oil prices climbing once more. The EU finalized its prohibition of financing and financial assistance services for Russian oil cargoes after a wind-down period of six months. The measure effectively bans EU member states from providing insurance to Russian trade.
Natural Gas
The spot prices of natural gas fell at most locations during the report week May 25 to June 1. The Henry Hub spot prices dipped from $9.30 per million British thermal units (MMBtu) to $8.42/MMBtu week-on-week. On the other hand, international natural gas spot prices rose or the week. Liquefied natural gas (LNG) cargoes in East Asia ascended by $1.89/MMBtu to bring the weekly average of LNG prices to $23.77/MMBtu. In the Netherlands, at the Title Transfer Facility (TTF) which is Europe’s most liquid natural gas spot market, the day-ahead price increased by $0.59 to a weekly average of $26.51/MMBtu. By comparison, last year’s corresponding average prices for the week ending June 2, 2021, in East Asia and the TTF were $10.54/MMBtu and $9.12/MMBtu, respectively.
In the domestic market, prices along the Gulf coast fell as temperatures remained close to normal, consumption fell in all sectors, and LNG exports decreased. In the Midwest, prices decreased as temperatures increased and demand for natural gas declined. Prices across the Midwest fell in line with the national average, while Northeast prices decreased due to mild weather on average, resulting in lower consumption. U.S. natural gas supply increased week over week, while demand fell as temperatures moderated toward normal. This week from last week, U.S. LNG exports decreased by one vessel.
World Markets
Decline and thin volume marked trading in the European stock market during the week that the UK celebrated the platinum anniversary of Queen Elizabeth II’s ascendancy to the throne. Investors were reticent due to elevated inflation, the prospects of an economic slowdown, continued restrictive policies and monetary tightening by the central banks, and the ongoing war in Ukraine. The pan-European STOXX Europe 600 Index closed the week down by 0.87%. Major indexes were weaker across the board. Italy’s FTSE MIB fell by 1.91%, France’s CAC 40 lost 0.47%, and Germany’s Xetra DAX Index moved sideways. The UK’s FTSE 100 Index dipped by 0.69% through Wednesday, on shortened trading for the week due to the holiday celebrations. Eurozone inflation soars to a record high of 8.1% in May, with commodity prices accelerating in the 19 member states at a rate faster than expected. Several policymakers now agree that rates need to be raised to curb inflation although they disagree on the pace of tightening, with some calling for a 50-basis point increase in July. The European Central Bank has maintained a negative deposit rate since 2014, which is now at -0.5%.
Japan’s stock markets recorded a gain for the week, with the Nikkei 225 rising 3.66% and the broader TOPIX Index climbing 2.43%. Continued relaxation of Japan’s strict border controls and the decision by Chinese authorities to allow segments of the economy to reopen after the coronavirus lockdown restrictions helped boost investor sentiment. After a two-year ban on foreign tourism due to the coronavirus epidemic, Japan has adopted further measures toward a wider reopening of its borders. The yield on the 10-year Japanese government bond ended the week unchanged at 0.23%, as the yen weakened to approximately JPY 129.88 per U.S. dollar, from JPY 127.10 at the end of the preceding week. Japan has also reiterated its commitment to monetary easing.
In China, stocks rallied during the holiday-shortened week in response to Beijing’s unveiling of support measures to cushion an impending economic slowdown. The slowdown was the anticipated result of the country’s zero-tolerance approach to the Covid-19 spread. During the trading week that ended Thursday, the broad, capitalization-weighted Shanghai Composite Index rose by approximately 2.1%, and the blue-chip CSI 300 Index, which tracks the largest listed companies in Shanghai and Shenzhen, gained 2.2%. Trading was closed on Friday in celebration of the Dragon Boat Festival. The government unveiled an additional 33 measures of its stimulus programs which it announced the previous week, covering fiscal, financial, investment, and industrial policies.
The Week Ahead
Among the important economic data to be released this week are the foreign trade balance, consumer price index, and hourly earnings growth.
Key Topics to Watch
- Foreign trade balance
- Consumer credit
- Wholesale inventories revision
- Initial jobless claims
- Continuing jobless claims
- Real household net worth (SAAR)
- Real domestic nonfinancial debt (SAAR)
- Consumer price index (monthly)
- Core CPI (monthly)
- CPI (year-over-year)
- Core CPI (year-over-year)
- UMich consumer sentiment index (preliminary)
- 5-year inflation expectations (preliminary)
- Federal budget balance
Markets Index Wrap Up