

An already strong 2018 performance could blunt traditional midterm effect: analyst
Maybe early voting isn’t just for elections. One prominent Wall Street analyst says the stock market may have already booked its traditional midterm election bounce.
A potential problem for stock-market bulls banking on postelection gains in keeping with past congressional midterm election years stems from the performance already logged by the S&P 500 SPX, +0.28% in 2018, said Brian Belski, chief investment strategist at BMO Capital Markets, in a Thursday note. The large-cap index was up 8.7% in 2018 through Wednesday’s close, while the Dow Jones Industrial Average DJIA, +0.21% advanced 6.7%. Both indexes defied seasonal September weakness to notch all-time highs last week.
“Another common discussion point has been market performance during midterm election years given that 2018 is one,” he wrote. “In particular, some investors have pointed out that the market typically stages a strong rally following the election—arguing for even higher S&P 500 levels.”
But Belski argues there are some important caveats that investors need to heed. Those caveats are also one reason why Belski said he isn’t inclined to raise his 2018 S&P 500 end target of 2,950 despite the index trading around just 1% below that level in Thursday action.
Data shows that, on average, U.S. stocks have tended to suffer in September during midterm election years only to regain their footing come October and then proceed to solidly outperform versus all other years through year-end and into the next year. Voters go to the polls on Nov. 6 in a hotly contested midterm election that surveys show could see Democrats take control of the House and possibly challenge President Donald Trump’s Republican allies for control of the Senate.
Indeed, the average fourth-quarter gain in midterm election years of 7.5% is more than twice the average of 2.9% for all other years since 1945, Belski said. But there are caveats, which he points to in the chart below.
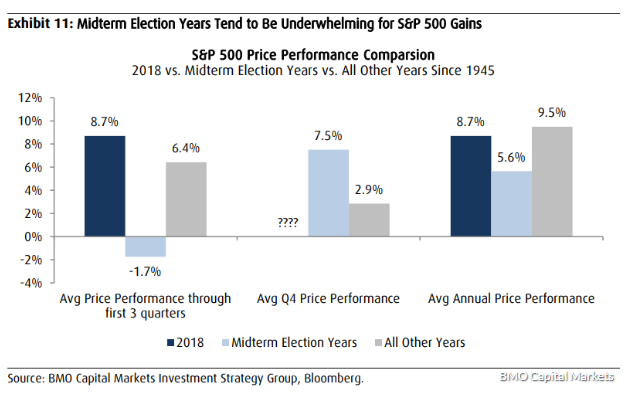
First, Belski said, the S&P 500’s 2018 performance to date—a gain of 8.7% through Wednesday’s close—is already significantly stronger than the average performance seen in the first three quarters of all other midterm years. In fact, the S&P 500 and has averaged a 1.7% decline over the first three quarters of past midterm years, he noted.
“Therefore, we believe that investors may have already ‘pulled forward’ any anticipated post-midterm election bump,” Belski said.

