Alibaba Holdings Group (BABA) Founder and Executive Chairman Jack Ma is planning to sell 9% of his position in the company over the next 12 months, as reported in a U.S. Securities and Exchange Commission filing on Wednesday. The performance of Alibaba this year has been nothing short of stunning. The stock is up 100% while Amazon (AMZN) is up a “mere” 32% year to date. By any number of technical indications Alibaba is clearly in an overbought condition, but it has been that way for a good percentage of this year’s rally. That is not a reason to sell the stock; neither is a sale by an insider, but it might be a reason to be cautious and monitor price action and technical levels for an exit strategy.

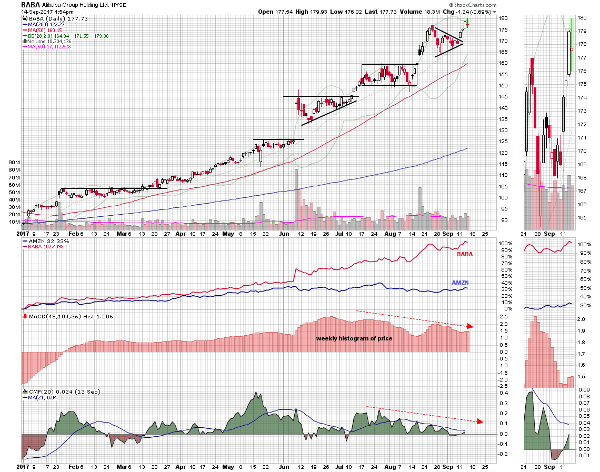
The daily chart shows the stock moving steadily higher in the first half of the year and then gapping up in June. At that point, brief rally periods were followed by periods of well-defined consolidation, which formed a rising triangle, a horizontal channel, and a wedge formation.
This week Alibaba broke out of its most recent consolidation and in Wednesday’s session it briefly made a new all-time high. It looks like a new rally phase may be underway, but let’s add some technical context to the pure price picture. A weekly histogram of the moving average convergence/divergence oscillator shows it declining over the last two months, in slight bearish divergence to the stock price.
Daily Chaikin money flow has also been making a series of lower highs beneath a declining 21-period signal average. These readings reflect an underlying weakness in price momentum and money flow direction. Let’s look at today’s price action.
At this point in Thursday’s session, the stock is pulling back off its highs and has formed a high wick or upper shadow candle. This doji-like or shooting star type of candle suggests an inability to hold its upper levels and is a signal a temporary high may be in place.
It is unlikely that one simple candle over one day’s price action could deter such a strong rally, but if this weakness continues into the close on Friday and the stock price drops back down below $175, it would form a high wick candle on the weekly chart. This would be the fourth consecutive high wick candle on this time frame and that “cluster” would be a serious concern for the sustainability of the rally.


